Reversal Patterns of Candlestick
Reversal patterns in trading, Reversal patterns in Candlestick, Most common reversal pattern
Course: [ JAPANESE CANDLESTICK CHART AND TECHNIQUES : Chapter 2: Candlestick Reversal Patterns ]
Technicians watch for price clues alerting them to a shift in market psychology and trend. Reversal patterns are these technical clues.
REVERSAL PATTERNS
Darkness lies one inch ahead.
Technicians watch for price clues alerting them to a shift in market psychology and trend. Reversal patterns are these technical clues. Western reversal indicators include double tops and bottoms, reversal days, head and shoulders, and island tops and bottoms. Yet the term "reversal pattern" is somewhat of a misnomer. Hearing that term may lead you to think of an old trend ending abruptly and then reversing to a new trend. This rarely happens. Trend changes usually occur slowly, in stages, as the underlying psychology shifts gears. A trend reversal signal implies that the prior trend is likely to change, but not necessarily reversing. Compare a trend to a car traveling forward. The car's red brake lights go on and the car stops. The brake light was the reversal indicator showing that the prior trend (that is, the car moving forward) was about to end. But now that the car is stationary, will the driver then decide to put the car in reverse? Will he or she remain stopped? Will he or she decide to go forward again? Without more clues we do not know.
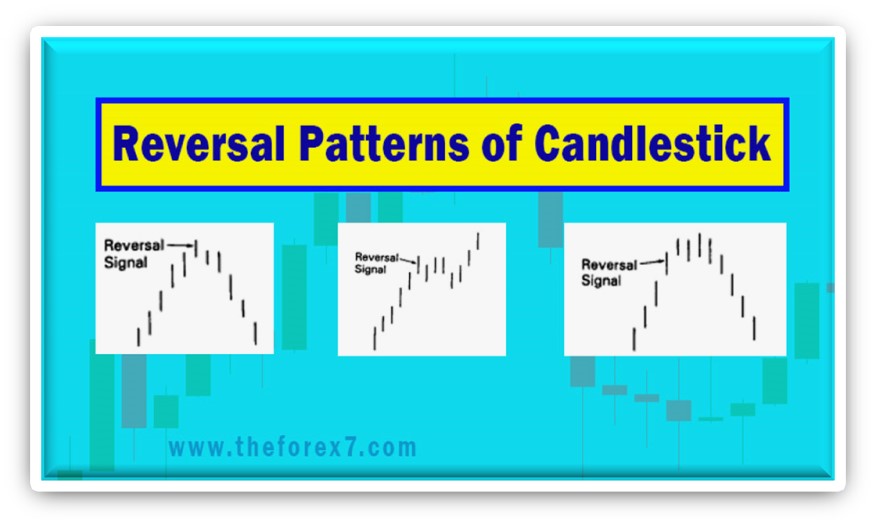
Exhibits 2.1 through 2.3 are some examples of what can happen after a top reversal signal appears. The prior uptrend, for instance, could convert into a period of sideways price action. Then a new trend lower or higher could start (see Exhibits 2.1 and 2.2). Exhibit 2.3 illustrates how an uptrend can abruptly reverse into a downtrend.

Exhibits 2.1 Top Reversal

Exhibits 2.2 Top Reversal

Exhibits 2.3 Top Reversal
Remember that when I say "reversal pattern," it means only that the prior trend should change but not necessarily reverse. It is prudent to think of reversal patterns as trend change patterns. Recognizing the emergence of reversal patterns can be a valuable skill. Successful trading entails having both the trend and probability on your side. The reversal indicators are the market's way of providing a road sign, such as "Caution — Trend in Process of Change." In other words, the market's psychology is in transformation. You should adjust your trading style to reflect the new market environment. There are many ways to trade in and out of positions with reversal indicators. We shall see many examples of this throughout the book.
An important principle is to initiate a new position (based on a reversal signal) only if that signal is in the direction of the major trend. Let us say, for example, that in a bull market, a top reversal pattern appears. This bearish signal would not warrant a short sale. This is because the major trend is still up. It would, however, signal a liquidation of longs. We could then look for a bullish signal on the correction to buy since the prevailing trend was higher.
I have gone into detail about the subject of reversal patterns because most of the candle indicators are reversals. Now, let us turn our attention to the first group of these candle reversal indicators, the hammer and hanging man lines.
JAPANESE CANDLESTICK CHART AND TECHNIQUES : Chapter 2: Candlestick Reversal Patterns : Tag: Candlestick Pattern Trading, Forex : Reversal patterns in trading, Reversal patterns in Candlestick, Most common reversal pattern - Reversal Patterns of Candlestick