Interpretation of Price and Volume
volume indicator strategy, Preice Action Trading Strategy, Best Trading Strategy
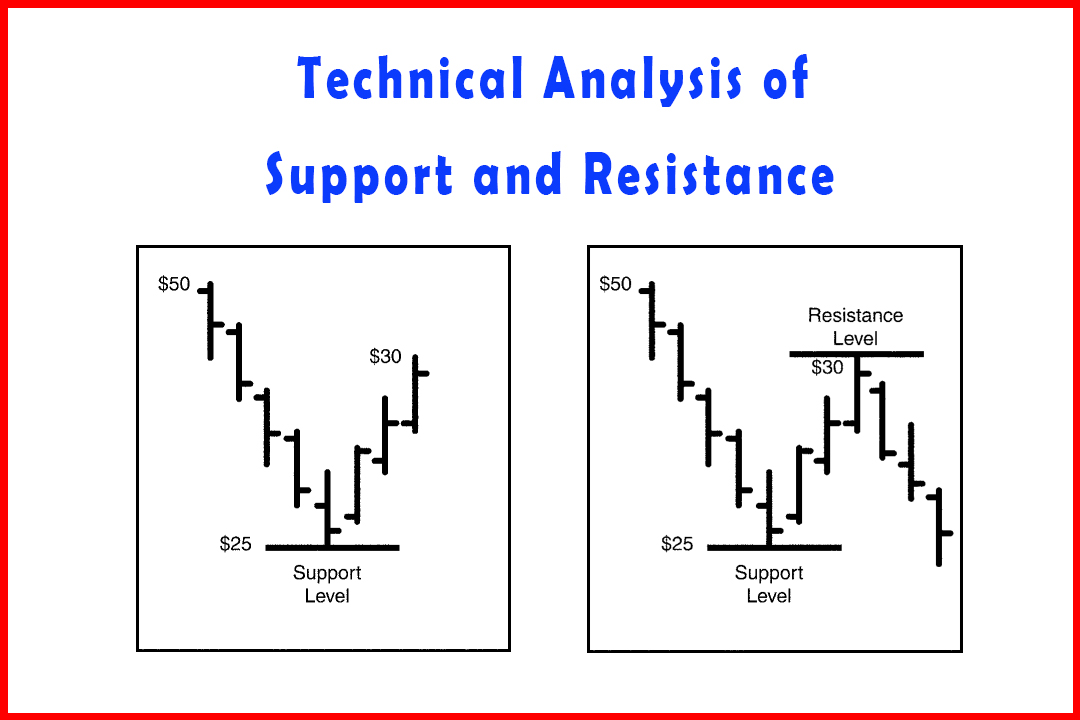
Course: [ Simplified Support and Resistance : Chapter 1. Technical Analysis of Support and Resistance ]
Daily movements of price, as a chaotic and momentary force, may appear to be setting net SR trends but, in fact, are merely part of a larger and longer-term pattern. Of equal importance, remember that identifiable trading ranges are not always present.
Interpretation of Price and
Volume Together
If we
limit our observations to price alone, we are likely to miss some important
emerging signals. We also need to keep an eye on trading volume. When buying or
selling volume levels change significantly,
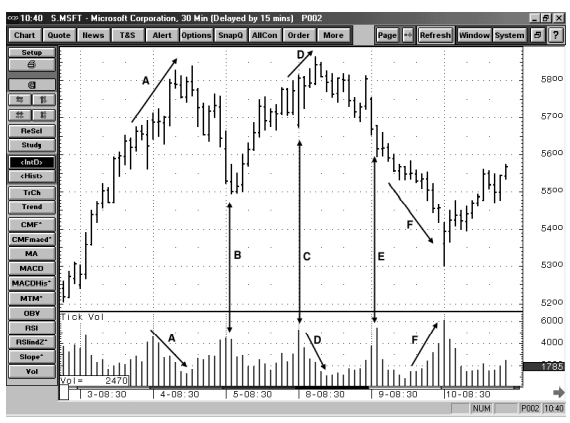
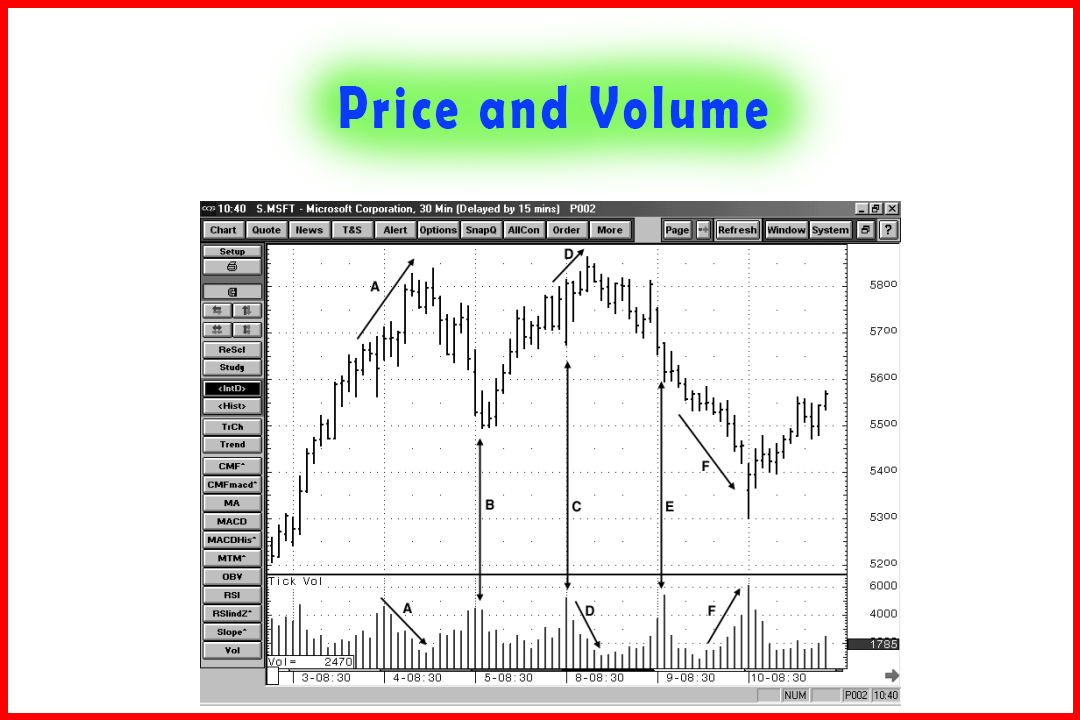
Figure
1-9
it could
signal a coming change in the price trend as well.
Figure
1-9 is a 30-minute bar chart of Microsoft (MSFT). Price trendline A is up but
the volume trendline A is down. As prices have moved higher, volume has waned,
indicting that fewer and fewer buyers are coming into the market. It appears
that the upward drive is exhausting itself. The price reacts by retreating back
down to form a low at $55. Here, the volume expanded noticeably, exhibiting a bottom-heavy
activity coupled with a downside price trend. Bargain hunters step up to absorb
the stock at its softer price level. At point C, the market opens lower and
rallies with volume at its highest level to this point. But as prices begin to climb
at trend line D, volume recedes. The market rolls over as prices fall; volume
expands (Point E) but prices continue to slip lower. Demand is not strong
enough to support that price level. Volume continues to rise (trend line F) as
price falls, until the price gaps down to $53, and volume reaches its highest
point on the chart.
When
prices climb and volume falls, buying activity is weakening. As prices fall and
volume declines, selling activity is exhausted. As prices fall and volume
rises, and as prices then hold in the same area with rising volume, that means
buying activity is growing in strength; if prices rise to a point that they
stall and volume continues to rise, it indicates that sellers are gaining
momentum.
Daily
movements of price, as a chaotic and momentary force, may appear to be setting
net SR trends but, in fact, are merely part of a larger and longer-term pattern.
Of equal importance, remember that identifiable trading ranges are not always
present. Highly volatile stocks often have not yet found a trading range, so
prices rise or fall in reaction (often overreaction) to many market forces. In
those cases of extreme volatility, few charting techniques are of any value.
Highly volatile stocks, by definition, do not possess a single trading range
and have to be viewed in a larger perspective. A stock's high volatility, in
and of itself, makes SR and other charting inapplicable.
Summary
Support
and resistance, the study of the interaction between buyers and sellers in
relatively low-volatility stocks, is the foundation of technical analysis. As
traders, the study of SR gives us a window into how most traders react to price
movement. Most traders do not try to forecast short-term price movements, they
follow trends as they emerge.
The
professional or active trader's ability to react swiftly to a new trend helps
him to understand the interaction between volume and price. The observant
technician understands that SR serves as a starting point for developing an
idea of what may occur next in price movements or patterns. However, he also
knows that short-term price movement has a random quality to it, and spikes or
waves may mislead the impatient trader, causing mistakes and misjudgments. A
patient trader awaits confirmation from a suspected change in the current
trend, remembering that important change is not going to take place every day.
By utilizing other indicators, the technician is able to use SR and emerging
chart patterns to anticipate the next step in price trends. The next chapter
explains how SR applies to one of the most important theories of the market,
the Dow Theory.
Simplified Support and Resistance : Chapter 1. Technical Analysis of Support and Resistance : Tag: Support and Resistance, Forex : volume indicator strategy, Preice Action Trading Strategy, Best Trading Strategy - Interpretation of Price and Volume