Technical Analysis of Support and Resistance
How to trade Support and Resistance, Studying a chart, Price movements
Course: [ Simplified Support and Resistance : Chapter 1. Technical Analysis of Support and Resistance ]
The defining nature of SR (Support and Resistance) is what gives it such prominence in the practice of technical analysis. We should remember that the purpose in price analysis is not to accurately predict the future, but to improve our ability to forecast correctly more often than not.
Support and Resistance: The Foundation of Technical
Analysis
The
defining nature of SR (Support and Resistance) is what gives it such prominence
in the practice of technical analysis. We should remember that the purpose in
price analysis is not to accurately predict the future, but to improve our
ability to forecast correctly more often than not.
This is
where support and resistance play a key role. In studying a chart of recent
price movements, we are likely to see a trading range. This is the area of
prices that can be clearly identified; recent trading activity is taking place
within that range. At the bottom of the trading range is the price (or price trend)
known as support. The support price level is an important signal point for
identifying likely emerging new trends. This price is where the trend is likely
to halt and possibly reverse a down trend—thus the name, "support,"
which means price support in the current perception of buyers. Support is
essentially the lowest price for the stock that is likely to be reached and
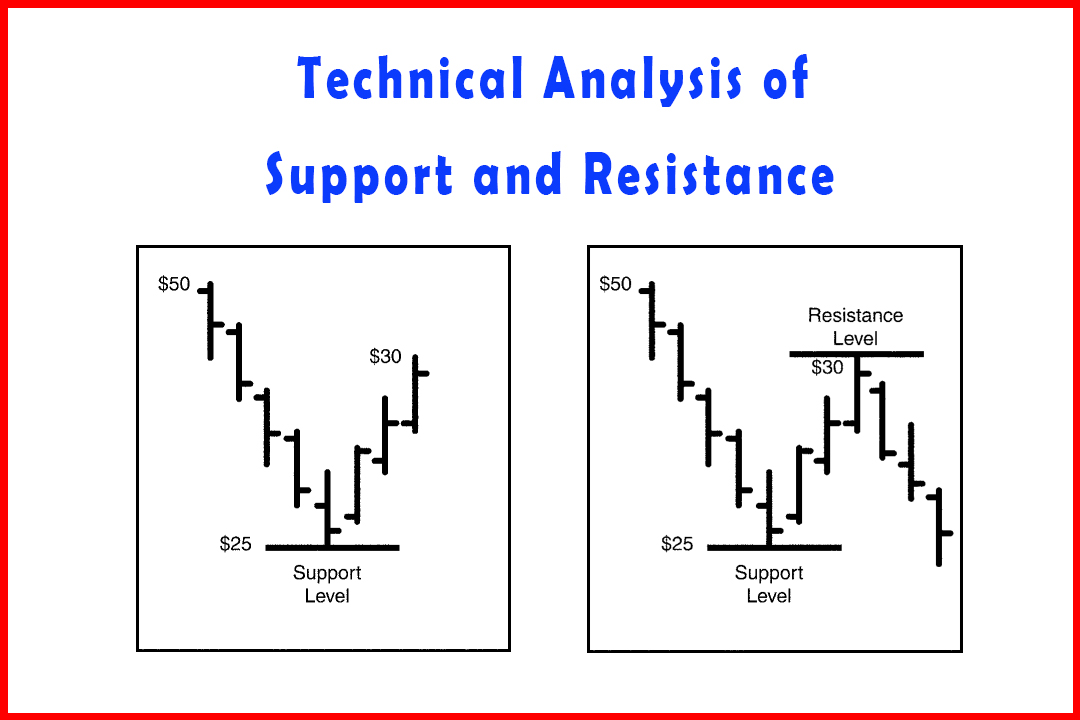
considered a worthwhile price to pay. If the price of a security has been
moving downward, for example dropping from $50 to $25 over recent trading
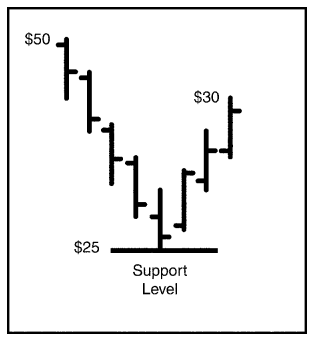
Figure
1-1
periods,
the price of $25 is the current support level. (Figure 1-1). Resistance serves
a similar identifying purpose, but on the top price side of the trading range.
A resistance level is the highest price that buyers consider worth paying for
the stock. If the stock has been trading between $25 and $30 per share, the $30
level is the current resistance level (Figure 1-2).
Several
writers have treated SR in purely economic terms, equating support with demand
and resistance with supply. While this analogy is useful for understanding the
market on economic terms, we should also realize that the market forces that go
into the creation of price movement often have little to do with economic
forces.
In
studying fundamental analysis (financial and other recent historical trends of
a company), there certainly are economic forces at work.
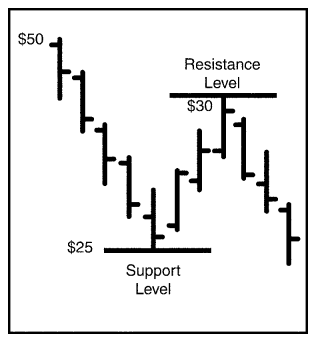
Figure
1-2
However, technical
indicators have to be distinguished from the economics of corporations and
viewed in terms of the forces at work in the market itself. When we think of
supply and demand, we usually visualize a business model. A company creates and
markets a product or service and has to compete with other companies in the
same industry. When there is a lot of demand for that product, sales rise; when
demand is soft, sales (and profits) fall. In this example, "supply and demand" are factors
affecting a company's profitability.
A study
of the stock market reveals entirely different forces at work. Price of stocks
really has little to do with economics as applied to sales and profits, the
traditional models. Rather, prices change due to investor demand rather than
market demand and the demand itself has nothing to do directly with a company's
competitive success. Of course, the more profitable companies will have
stronger price attributes in its stock, but the forces of supply and demand
really do not affect price. In fact, it is fair to say that stock prices rise
and fall as a result of a collective market perception of value. Today's rise
or fall in a stock's price occurs in anticipation of what will happen next.
When investors buy stock, they do so assuming that the price is going to rise;
and when they sell, they are taking profits or reacting to changed perceptions
about future value. An attempt to tie together the traditional supply and
demand features of economics and market price movement is not an accurate
approach.
As
technical analysts, chartists generally are not at all interested in economic
forces such as supply and demand (on a purely market level). Rather, they are
interested in the perception of price support and resistance for individual
stocks given a number of other factors: current trading range, recent trading
patterns within the trading range, whether the range itself has been drifting
up or down, signs of support exhaustion, profit-taking, and other trends
related to price, not to the economy. SR does not apply well to market indexes,
because no one trades the index (except through limited index options). Since
an index represents a broad crosssample of many stocks, it cannot possess an
individual SR. While an index trading range may appear to be acting in the same
manner as that of an individual stock, it is not the same. The trading range of
the index is a culmination of many trading ranges, and it is simply the
averaging effect of those components that creates this artificial "trading
range."
By the
same argument, an index cannot exhibit the patterns known to belong to
individual stocks. Since the index is a composite of many stocks, including
those with disparate trading ranges and trends, there is a washing effect in
the index itself. For many technicians, the index is useless for the purpose of
evaluating individual stocks, which is what most investors would be expected to
use SR to accomplish.
Even the
individual stock will exhibit certain characteristics that may be signals or,
in some cases, merely coincidence. We have to assume a certain amount of random
movement in the market, if only because the underlying forces are rarely
consistent. The interests of sellers and buyers are opposite one another, so no
legitimate weight should be given to "the market" as a single entity.
In fact, the trading range itself is nothing but the average of market
sentiment about that stock.
This,
however, is where SR is most valuable. We assume that within that overall
market for a particular stock, the trading range exists because buyers and
sellers have entered into a silent agreement concerning the reasonable price
level. Fluctuations occurring within that level, or trading range, represent
the day-to-day buying and selling—the jostling among participants—as the price
moves around within its trading range. However, the trading range is not the
range of supply and demand, but rather a reflection of the current status of
the auction marketplace. Supply and demand is an economic force that affects
prices within markets, and market trading ranges and accompanying SR are the
defining qualities inherent in the free exchange between buyers and sellers.
The distinction is an important one.
Not everyone agrees that there should be such a precise distinction between economic supply and demand versus stock price trends. One author referred to concentrated demand and supply as part of the analysis of why and how prices are likely to move next, and what those trends actually mean in economic terms.1 The same author observed one general rule of price trends: "supply" (or, more accurately, a new support level) often will be found at a previous trading range's resistance level (Figure 1-3). In other words, when today's trading range is replaced with a new higher trading range, such a shift could be expected to become established. The same is true in the opposite direction: When today's trading range is replaced with a
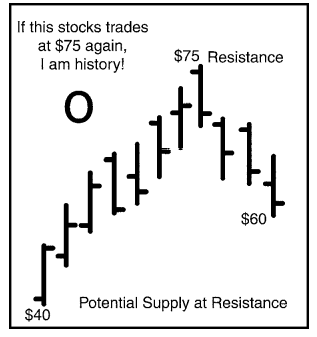
Figure
1-3
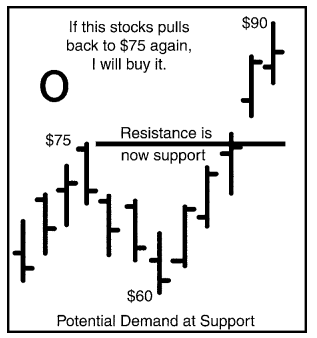
Figure
1-4
new lower
trading range, then "demand" (a new resistance level) is likely to be
located at or near the previous trading range's support level (Figure 1-4).
This is an important concept in the analysis of SR, because as the trading
range shifts, we can expect to identify these new support or resistance levels
as a starting point for further analysis. However, the debate continues: Do
these levels represent supply and demand? Or are they markers for the price levels
that provide limits to the auction itself? An observer of market forces will
notice that prices seem to move in the most illogical ways, often surprising
everyone and defying any logical economic analysis. This alone gives
credibility to the belief that SR is a feature of the auction. Were these SR
levels truly representative of valid supply and demand forces, then their
movement would be expected to occur in some dependable, predictable, and
economically sensible manner. In the stock market, this is not a likely manner
for prices to move. Instead, the tendency is for the trading range to become
established (assuming the stock price is not behaving in an overly volatile
manner), which provides a sense of reliability for near-term price movement. In
fact, some technical analysts move back and forth between long and short positions
based on relative price position within the trading range, based on the
presumed dependability of that range in the near term. For such traders,
success is most likely when the trading range has been well established in
terms of breadth. This means it may be edging upward or downward, but the
relative distance between support and resistance remains constant. While
trading ranges often broaden or narrow, the most desirable model for a trading
range is based on the likelihood that, given interim distortions, the breadth
of the trading range is consistent. The longer this consistency lasts, the more
stable (and less volatile) price movement is considered to be; and the easier
it is for the technician to anticipate price change.
The study
of SR usually involves these well- established trading ranges, meaning that, in
addition to breadth remaining constant, they unfold over a period of days,
weeks or even months.
While
prices can and do change rapidly within a single trading day, the usual purpose
to SR analysis involves current price changes within or away from
well-established SR parameters. Trends up or down within a single day may be
given many names by chartists, but single-day changes should not be confused
with the concept of SR. The usefulness of SR analysis is in providing an
established starting point to analyze or explain daily fluctuations. Thus, any
exceptional spikes may be discounted and even ignored as long as they do not become
part of a repetitive pattern, testing or violating SR limits. The occasional
aberration should be treated as just that and largely ignored.
Some
technicians have observed trends in price as "buying and selling
waves," noting that such waves can vary in duration, can be exhausted
rather quickly, or may be offset by other waves moving in the opposite
direction.2
This is
an important point. A "wave" of short duration might, in fact, serve
as a false indicator just like the exceptional spike, misleading the analyst
from more dependable, longer-term conclusions. In the study of statistics, such
misleading indicators have to be discounted because they do not represent the
ongoing trend. They are a reflection of the short term chaos that is going to
characterize any population (individuals, age ranges, political party members,
or the random short-term movement of stock prices, for example). The
established trading range, with its support and resistance levels, is the more
dependable, established trend that is worth observing. By understanding the
importance of the range—and also knowing that a breakout (price movement above
resistance or below support) does not occur frequently, we are able to stay on
course and not be misled by day-to-day aberrations. This is one value to SR; it
provides us with a reliable means for evaluating short-term price movement and
patterns, ignoring one-time changes and acting only on trends that are
confirmed independently (more on these methods later).
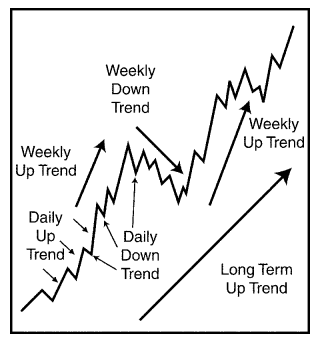
Figure
1-5
The long-term trend in a stock's price is the established trading range. It probably is not flat but tends to move gradually in one direction or another, but still with easily distinguished features. Within the overall direction of the long-term trend are weekly trends that are up and down, and within the weekly trends, there are daily trends that are up and down (Figure 1-5). These movements may temporarily violate the established trading range; but without confirming signals, they are not proof of a permanent change. It is the intermediate trend that could forecast an emerging new trend, or one that could become exhausted and disappear. Of even shorter duration, short-term trends last from hours up to days, and finally, the smallest of trends, intra-day trends, last from minutes to hours. Chartists are constantly referring to prices that "test" support or resistance. Thus, a price might move up to resistance and break
through,
only to retreat, or move below support momentarily, but immediately return to
the range.
A few
points to remember about prices "testing" the outside levels of the
trading range:
1.
Prices are not conscious, so they cannot
"test" as a human can. The terminology is misleading in that regard.
2.
Short-term trends are entirely unreliable,
and in the next chapter, we will examine the two major market theories, both of
which agree that short-term trends have to be discounted and even ignored.
Chartists know that "tests" are not really forms of reconnaissance on
the part of some conscious being but are part of the chaotic nature of price
movement itself.
3.
The actual price dynamics are not controlled
by individuals but as a collective market. The market version of supply and
demand is far from the economic form; the auction marketplace reflects the
interactions between buyers and sellers, all bidding and asking at the same
time. Institutional investors (mutual funds, insurance companies, and pension
funds, for example) have far more influence on price than the individual or
retail investor.
4.
You are better off acting within the longer-
term price range analysis than reacting to short-term price movement. Such
intra-day trends are entirely unreliable for the more studious chartist.
The
chartist views SR as the starting point of the chart. Once SR is established,
the chartist begins looking for signs of new emerging trends. Three types of
charts have come into popular use in
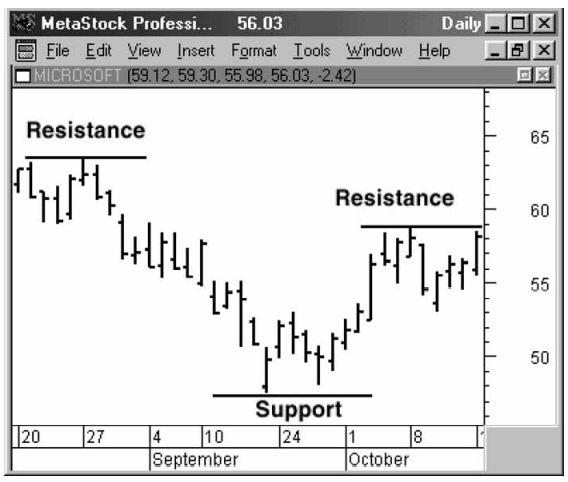
Figure
1-6
studying
price trends: vertical, figure (today known as point & figure) and wave
charts. The vertical charts are the open-high-low-close charts commonly used
today (Figure 1-6). Some technicians have not considered chart patterns or
technical indicators to be of any value. Instead, they have favored vertical
charts for identifying price trend levels, comparative strength and weakness,
and from these items the timing of when to buy, sell or place stop orders.3
Point and
figure charts (Figure 1-7) are used to determine accumulation or distribution
areas, as well as forecasting price levels that could represent
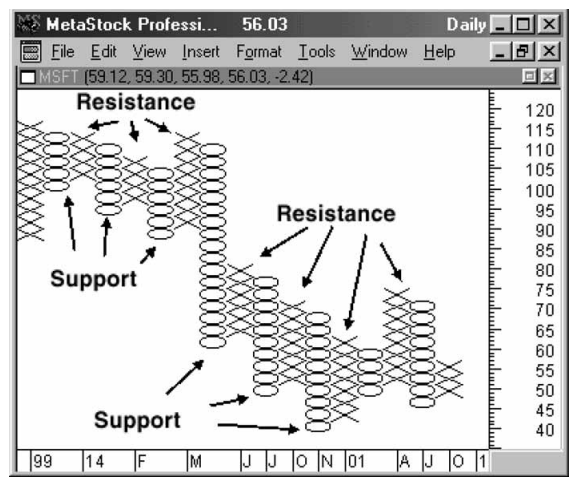
Figure
1-7
future
support or resistance levels. The point and figure chart does not use time for
the horizontal axis. Figure 1-7 shows what is called a 3 X 3 chart. If the
stock moves up by $3 dollars then an "X" is plotted. As long as there
is not a retracement (retreat in the opposite direction) of $3 or more, then
the trend is up. If the stock falls by $3, then an "O" is plotted. In
Figure 1-7 the downtrend in the middle of the chart is a series of lower
support and resistance points.
SR, of course,
is not an isolated factor, but the underlying guiding force in chart analysis.
Wave charts help identify emerging patterns in SR. Remember, the trading range
is rarely unchanging for long. An active stock is likely to trade in a progressing
series of trading ranges that gradually move upward and downward, and sometimes
reversing course as a matter of trading pattern over time. This is where the
wave chart is a useful tool in SR analysis.
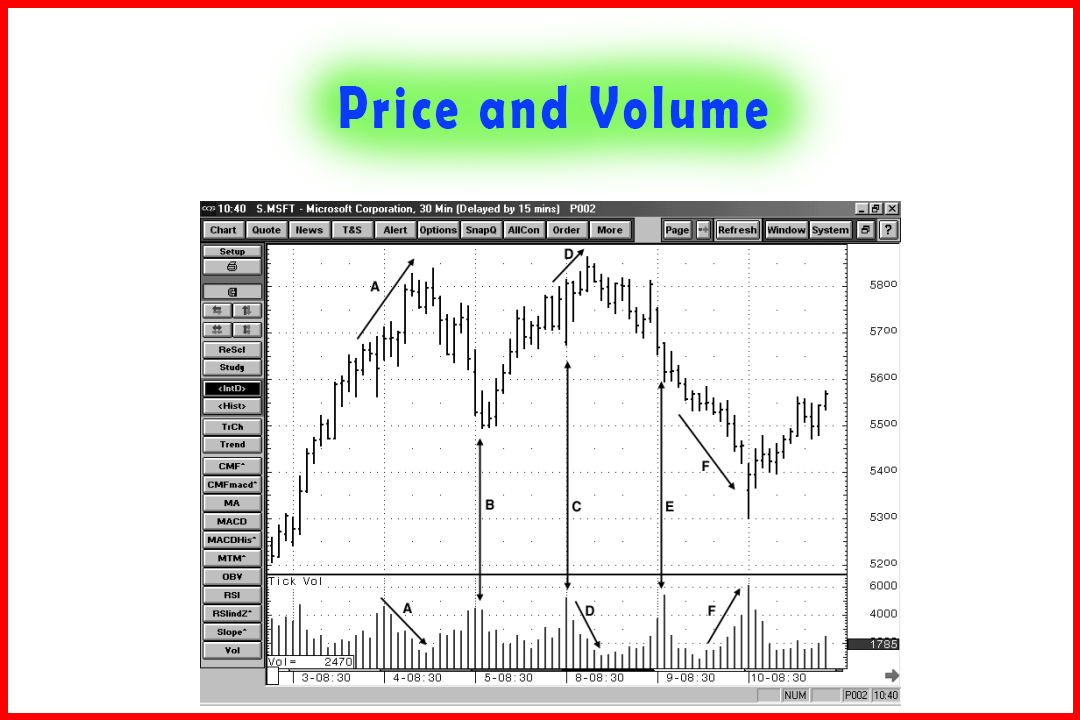
Wave
charts are line charts (Figure 1-8). They are used to track smaller and
shorter-term waves, medium-duration waves, and longer-duration waves. We can
measure the duration of each wave, thus identifying the relative strength in
what
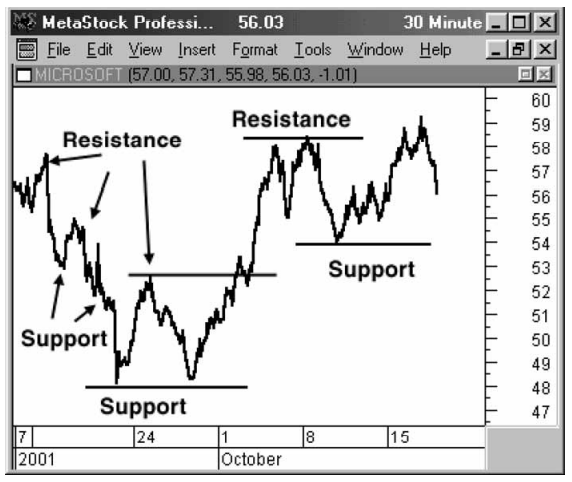
Figure
1-8
we
perceive to be (a) current trading range and (b) trend direction. For example,
Figure 1-8 is a 30- minute line chart of Microsoft, and you can see on the left
hand side of the chart how the downtrend from $58 to $48 is a series of falling
price points. Notice that during the decline support points give way while resistance
levels hold. Next, a double bottom (two tests of the same support level) occurs
just above $48, a major warning. Then the resistance level at $52.50 is broken,
and now we see rising support points and falling resistance levels.
A
cautionary word: Applying the theory of yielding or holding SR levels within
single days is contrary to the very idea of longer-term SR significance. The
above example is useful for illustrative purposes and momentary changes could
serve as dramatic signals as long as they are confirmed independently, and as
long as that conclusion is supported in subsequent price changes. However, SR
is not useful for making decisions on Intra-day trading. Most day traders are
less concerned with SR and are far more interested in price aberrations. Under
the SR concept, we prefer to ignore the daily aberrations, recognizing them as
just that; and we prefer to use SR as a tool for identifying longer-term
trading range trends.
The
purpose of SR analysis is far more applicable to longer-term analysis. Some
technicians have observed that accumulation and distribution areas, or trends
relating price to volume, are helpful in identifying likely price tops and
bottoms.4
Under
that theory, a downtrend ends when market demand reverses a downtrend. Market
supply reverses an uptrend in the same manner. This interaction between demand
and supply of securities creates trends and the subsequent reversal of those
trends under this theory. Here again, we have to qualify the observation about
supply and demand as a matter of definition. It is dangerous to confuse price
trends in the auction marketplace with the supply and demand forces at work in
the economy. Price of stocks is not directly caused by economic supply and
demand. In the context that identifying market tops and bottoms is associated
with supply and demand, it is perhaps more accurate to state the theory in
another way:
"Observing
the accumulation and distribution areas of price in a stock, coupled with
observations of changing volume on the buy side or sell side, can be used to
confirm the pricing trends that are observed in SR analysis."
We avoid
mixing up economic supply and demand in this restated version of the theory to
help avoid the confusion. It is a mistake to come to believe that technical analysis
and, specifically, charting is a science rooted in economic supply and demand.
We can
learn a lot, though, from watching how buying and selling activity change along
with changes in volume as a means for confirming what we see happening to the
stock's trading range.
Simplified Support and Resistance : Chapter 1. Technical Analysis of Support and Resistance : Tag: Support and Resistance, Forex : How to trade Support and Resistance, Studying a chart, Price movements - Technical Analysis of Support and Resistance