Major Factors Affecting Call-Writing Returns
Stock, Strike Price, Expiration, Volatility, Interest Rates, Strategy, Institutional
Course: [ OPTIONS FOR VOLATILE MARKETS : Chapter 3: The Basics of Covered Call Writing ]
Options |
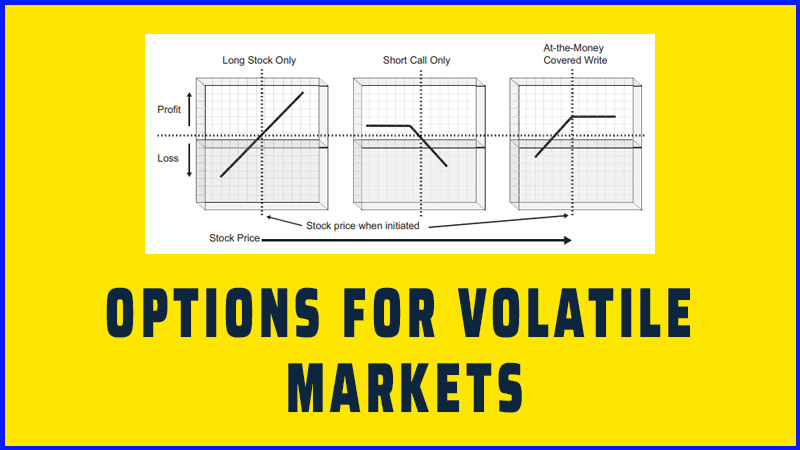
Returns from covered writing will depend very much on how you implement the strategy your choice of stock, strike price, expiration, and your follow-up program (rolling).
Major Factors Affecting Call-Writing Returns
Returns from covered writing will
depend very much on how you implement the strategy—your choice of stock, strike
price, expiration, and your follow-up program (rolling). Above all, covered
call writing is an equity strategy, and its results will be reflective of the
performance of the underlying equities in one’s portfolio.
Stock Selection
If you are picking stocks specifically
for a covered writing portfolio, you may find that you will gravitate toward a
somewhat different set of criteria from that employed to select stocks for
outright purchase, whether as long-term holds or as short-term trades. Instead
of picking stocks for long-term appreciation potential, you will more likely
focus on the shorter-term scenario, where the “shorter term” will coincide with
the duration of the option you write. That will generally lean you more toward
technical analysis than fundamental analysis as your decision mechanism.
A common trap in call writing is to
look for stocks with the largest option premiums under the assumption that
fatter option premiums will generate higher returns on the same amount
invested. They do generate higher returns, but only when they succeed. It’s
much the same logic as betting on the horse at 10-1 odds instead of the horse
with 2-1 odds. The 10-1 horse will pay five times as much, but should only win
one-fifth as often. Fatter option premiums exist on higher-volatility (i.e.,
higher beta) stocks because the stocks tend to move more in both directions.
So, while you receive more option premium, you have a commensurately higher
risk on the stock itself. A better approach is to determine whether the options
on a particular stock are abnormally high or low, and that is discussed in the
Volatility section later in this chapter.
It is also important to remember that
higher call premiums cannot necessarily be taken as a signal that the market
feels the stock has a greater chance of moving up than down. As we mentioned
previously, both call and put options will expand in price when volatility in a
stock jumps. Bad news on a stock may drop the price and create a surge in
demand for puts, but in that situation, both calls and puts will expand due to
higher implied volatility. Therefore, if you are focusing only on the calls for
covered writing and you see that the percentage return from a covered call
write on the stock has jumped recently, it might have been due to greater
expectation of a drop in price than a rise. A classic example of this would be BP
stock after the Deepwater Horizon rig explosion in April 2010. In the aftermath
of the explosion, the stock dropped precipitously and implied volatility
skyrocketed. If you were using an online filter to screen for covered writes
with the highest potential returns, BP would have surely been near the top of
the list at that point. But the reason it was there was because holders were
desperate for put protection in case the disaster caused additional harm or
sent the company into bankruptcy. The resulting implied volatility made the
stock look like an enormously attractive covered call write at that point in
time—but not necessarily because the market was overly bullish on the stock.
(One way to give yourself a sanity check on a stock with high option implied
volatility is to see if the volume of trading activity is higher on the call
side or the put side.)
There is no right answer for everyone
regarding stock selection, whether writing calls or not. As with buying stocks
without writing calls, you are always well-advised to diversify, regardless of
your method of stock selection. A big boost to covered call writers is the
introduction of ETFs on market sectors, broad indexes, and even commodities,
upon which calls are available. Covered call writing on these ETFs may reduce
or even eliminate entirely your need to diversify your holdings, and the
call-writing strategy works exactly the same on ETFs as on individual stocks.
Chapter 8 is devoted to a discussion of options on ETFs.
Strike Price
The strike price with the greatest
amount of time value is always the one closest to the current price of the
stock. Consequently, the farther away the strike price is from the current
stock price, the lower the static return (return unchanged) for the position. Table 3.2 illustrates this point.
Remember that this is not the only
factor you should consider when deciding which strike to write. Lower strike
prices will provide greater downside protection, while higher strike prices
offer greater potential gains from the stock. You should, however, understand
how these trade-offs affect your static return.
You can see from the table that the
difference between writing the Sep 35 call and the Sep 40 call is 5.4
percentage points. Remember that this is only a two-month return. On an
annualized basis, the difference between writing the near-the-money call and
the next higher strike price is more than 30 percentage points in return. Of
course, this is the static return and therefore ignores appreciation in the
stock, but it gives you a perspective on how much return from option premium
you give up when you write a higher strike price in the hope that the stock
will move up. The higher you go in strike price, the greater the potential
return from a covered write, but the lower the contribution from option premium
and the more uncertain the overall return.
If we take Table 2.1 from Chapter 2, which showed how time value varied with
strike price, we can look at the impact that has on covered call returns.
TABLE 3.2 Call-Writing
Returns at Different Strike Prices
|
Price of XYZ stock = 50 Volatility = 20% Days to expiration = 60 Interest rate = .5% |
||||
|
Strike Price |
Option
Price |
Time
Value |
Annualized
Return if Exercised |
Annualized
Return if Unchanged |
|
40 |
10.04 |
.04 |
.5 % |
.5 % |
|
42.5 |
7.57 |
.07 |
.9 % |
.9 % |
|
45 |
5.21 |
.21 |
2.6 % |
2.6 % |
|
47.5 |
3.15 |
.65 |
7.9 % |
7.9 % |
|
50 |
1.64 |
1.64 |
20.0
% |
20.0
% |
|
52.5 |
.71 |
.71 |
39.0 % |
8.6 % |
|
55 |
.26 |
.26 |
64.0 % |
3.2 % |
|
57.5 |
.08 |
.08 |
92.2 % |
1.0 % |
|
60 |
.02 |
.02 |
121.9 % |
.2 % |
Clearly, the selection of strike price
will vary results extensively. But you will not know which strike is optimal
when you initiate the position. Therefore, it is necessary to go with a strike
price that fits your risk tolerance or upside expectation each time you write.
Writing OTM calls such as the 57.5 or 60 strike calls in Table 3.2 provides an exceptional return when the stock makes a 7
to 10 percent move in 60 days, but provides subpar returns when the stock does
nothing or declines during that period. Unless there is reason to believe the
stock may have a significant drop or rise in the next two months, the strikes
between 47.5 and 52.5 provide the best combination of attractive return and
safety.
Expiration
The selection of expiration month will
also affect the expected returns of your covered writing program, because
options do not lose time value (decay) at the same rate throughout their life.
The differing rate of decay is important and can have a significant effect on
the returns from the strategy. It is also why we emphasize that while covered
writing can certainly be an ongoing approach, each individual write is a
relatively short-term strategy.
TABLE 3.3 Percentage
Return from Different Durations
|
Price of XYZ stock = 50 Volatility = 20% Interest rate = .5% |
|
|||
|
Expiration |
Time
Premium |
Premium
per day |
% Return
Unchanged (Annualized) |
|
|
30 days |
1.15 |
.038 |
28.0 % |
|
|
60 days |
1.64 |
.027 |
20.0% |
|
|
90 days |
2.01 |
.022 |
16.3 % |
|
|
120 days |
2.33 |
.019 |
14.2 % |
|
|
360 days |
4.07 |
.011 |
8.1 % |
|
In
Chapter 2, we showed how time value diminishes slowly at first and then
accelerates closer to expiration. The faster time value declines in an option,
the better it is for the writer, and the writer will garner more time premium
by writing one month options for three months in a row than by writing a single
three-month option to start. This means that option writers garner higher
annualized returns by writing shorter duration options, and the difference can
be considerable. Table 3.3 shows the
difference in annualized returns by writing options of different durations. For
purposes of comparison, one has to assume all other factors remain equal and
that the ETF remains at exactly the same price for a year. While this is
obviously not a reflection of reality, we can at least isolate the time value
aspect to demonstrate the difference between durations. The new weekly options
(available only on a dozen or so stocks and ETFs at the present time) offer a
unique opportunity for ultra short term covered writes. This technique will be
discussed further in Chapter 5.
There are expected trade-offs to using
the shorter duration options in covered writes. The writer needs to take
follow-up action more often during the year and transaction costs are
accordingly higher. One concern about short duration writing is that the calls
have less time premium and therefore offer less downside protection than longer
duration options. It is true that you take in more total premium by using a
more distant expiration month, but you don’t necessarily gain much in near-term
protection unless the stock falls considerably.
TABLE 3.4 Price Protection
from Long-Dated Calls
|
Price of XYZ stock = 50 Volatility = 20% Interest rate = .5% |
|
|||
|
Expiration |
Protection
from 1-Point Drop |
Protection
from 3-Point Drop |
Protection
from 5-Point Drop |
|
|
30 days |
.44 |
.51 |
1.11 |
|
|
60 days |
.47 |
.66 |
1.46 |
|
|
90 days |
.48 |
.67 |
1.55 |
|
|
120 days |
.50 |
.77 |
1.79 |
|
|
360 days |
.53 |
.93 |
2.23 |
|
That’s because more distant options
assume wider price swings over time and do not vary as much with price moves in
the stock. In option parlance, they have lower delta. Using the same example
again, Table 3.3 shows how much protection would be provided by the various
expiration months available in scenarios in which the stock drops in the first
month to $32, $30, and $25.
Table 3.4 shows the differing time values and returns for call
options with the same strike price but different expirations. The strike used
is 50, because it is ATM and thus all the option premium is time value. Returns
are annualized for comparison purposes, since the time periods involved are all
different.
Table 3.4 shows that which expiration provides the most protection
depends on how much the stock actually drops. In general, for better overall
returns from covered writing, you will want to write a relatively close option
most of the time. But if you want protection from the possibility of a
significant drop in price, a more distant call may be warranted. We recommend
covered writers generally use durations of one to three months and then adjust
to fit personal preferences.
Volatility
As shown in Chapter 2, the time value
in option premiums varies directly with volatility, and since stocks all have
different inherent volatilities, the stock selection on your covered write
takes volatility into account and will determine your potential return from
that call write. But as we stated earlier in this chapter, one should not jump
to the conclusion that writing calls on the most volatile stocks will
necessarily provide the highest returns. While their premiums, and thus the
potential returns, are indeed greater, the downside risk is proportionately
greater as well. A better way to give yourself a statistical edge in call
writing is by writing calls on stocks where the implied volatility (that
forecast by the price of the call option) is greater than the actual volatility
that is characteristic of that particular stock.
In other words, writing call options on
higher volatility stocks doesn’t necessarily provide an edge, but writing
options that tend to be overvalued, whatever the volatility of the stock, may
improve your success. One must bear in mind, though, that determining when an
option is overvalued is not an exact science. (If it were, the arbitrageurs
would be all over it.) The Black- Scholes formula provides a guideline. Because
it uses actual historic volatility, we can identify options that are trading
above the Black-Scholes price and conclude that they are trading above
historical volatility for that stock. But that, by itself, doesn’t mean they
are necessarily overvalued. In reality, there is no way to know when options
are truly overvalued or when they are perhaps more accurately reflecting future
volatility.
An additional approach is not just to
look for the highest premiums you can find relative to stock price, but to look
for high implied volatility relative to previous implied volatility for that
particular stock or ETF. This is discussed further in Chapter 5.
Interest Rates
Since option premiums are affected by
interest rates, returns from covered writing will be as well. It takes a
substantial move in rates, however, to affect premiums. (LEAPS options of one
or more years in duration are much more sensitive.) Table 3.5 shows the effect of different interest rates on premiums
and returns for a hypothetical two-month option.
Covered Writing as an Ongoing Strategy
The prevailing assumption in the early
days of options (1970s and 1980s) was that writing calls on stock positions had
merit only when specific situations existed, such as a concentrated position in
low cost basis stock that a client wouldn’t sell, or speculative fever surrounding
potential takeover candidates. Brokers and professional money managers had a
difficult time justifying the sales of covered calls on stocks they liked for
long term fundamentals as they assumed call writing would force them to accept
lesser long term returns.
TABLE 3.5 Effect of Interest Rates on Option
Returns
|
Stock Price = $30 Strike Price = 30 Days to Expiration = 57 Volatility = 0.30 |
||
|
Interest
Rate |
Premium |
Return
Unchanged (Not
Annualized |
|
2.0% |
1.46 |
4.9% |
|
3.0% |
1.49 |
5.0% |
|
4.0% |
1.51 |
5.0% |
|
5.0% |
1.53 |
5.1% |
|
6.0% |
1.56 |
5.2% |
|
7.0% |
1.58 |
5.3% |
|
8.0% |
1.60 |
5.0% |
|
9.0% |
1.63 |
5.4% |
|
10.0% |
1.65 |
5.5% |
And when the fundamentals soured on a
given stock, the tendency would be to simply sell it and buy a different one.
No doubt, such sentiment may have been supported by the fact that much of the
industry made their living on commissions.
The
BuyWrite Index (BXM)
Meanwhile, institutional investors kept
the flames of covered call writing alive and began using it frequently enough
that they petitioned the CBOE to provide them with a covered writing index upon
which they could benchmark their performance. The CBOE responded to their
wishes in April 2002 with the creation of the CBOE BuyWrite Monthly IndexSM
(BXM). The BXM tracks a hypothetical portfolio that is long the S&P 500
index (SPX) and short the one-month call option on that index at the nearest
out-of-the-money strike price. As each option expires, the net gain or loss is
registered, and the next month’s option is written. (For more information on
the details of the BXM, visit the BXM micro site at www.CBOE.com.) Like most
other major market indexes, the BXM is designed to emulate a passive
(unmanaged) return against which portfolio managers can gauge their performance
on actively managed accounts. In addition, perhaps even more importantly, the
BXM allowed the investing world to see how a passive call-writing strategy
performs over time with the buy and hold strategy on the underlying index
itself. When originally introduced, the BXM has been calculated back to June 1988,
when Standard & Poors began tracking the dividends on the S&P 500
Index. The returns of the S&P 500 Index (or more accurately, the S&P
Total Return index which has the dividends reinvested) were then compared with
those of a basic covered writing program (as represented by the BXM) over more
than a decade prior to launching the BXM. The results created a stir among
professional investment managers who spend their lives searching for ways to
produce competitive returns with less risk.
As expected, the BXM outperformed the
S&P index in years where the S&P was down or had single digit returns,
and underperformed versus the S&P during years when the S&P performance
was strongly positive. The BXM also lowered the volatility in monthly performance
by about one-third over the S&P. The biggest news of all, however, was that
the lower volatility did not come at the expense of long-term return, as people
tended to expect. Instead, returns over the 13.5-year period came within 0.2
percentage points of the S&P 500 returns for that entire period (13.88
percent for BXM versus 14.07 percent for the S&P)—a remarkable showing for
a strategy that lowers risk.
Bear in mind that these results provide
a very broad benchmark of what a basic mechanical covered writing program can
do compared with the buy- and-hold approach. Your portfolio is unlikely to be
anywhere near as diverse as the S&P 500. Also, the BXM assumes a
mechanically implemented program using one-month at-the-money calls only,
without any rolling, and it doesn’t take into account transaction costs or
taxes. Nevertheless, the BXM clearly demonstrates that although the returns
from covered writing may be lower than those stocks that are capable of
producing during a given period, they are commensurate with the returns stocks
actually generate over the long term—with a substantial reduction in
volatility. Thus, it provides an important affirmation of the long-term
validity of covered writing.
Since 2002, the BXM has continued to
perform in line with the prior 13 years, and the CBOE added a related index
(BXY) that utilizes a slightly more out-of-the-money call each month. As one
would expect, the BXY will perform better than BXM in up markets and not as
well in down markets. A chart of the results from 1988 through 2010 for both
BXM and BXY versus the S&P is shown in Figure 3.4. At this point in time,
both the BXM and
FIGURE 3.4 Comparison of BXM, BXY, and
SPTR

BXY are outperforming the S&P for
the 22-year period, no doubt helped by the lackluster performance of the
S&P during the last 10 years.
Summing Up Covered Writing
Chapter 4 discusses the various ways to
implement covered call writing. But before we go there, we thought we’d
summarize the basic pros and cons of the strategy.
Advantages
- Lower volatility. Whatever the underlying instrument, covered call writing on it will lower the volatility. The BXM has been shown to have approximately one-third less month-to-month volatility on the S&P 500 Index when writing an ATM call option each month.
- Similar long-term performance compared with buy-and-hold. The reduction in volatility (as shown for the BXM) does not reduce the long-term performance of a straight buy-and-hold strategy on the same underlying instrument.
- Modest short-term downside protection. ATM or OTM covered writing provides modest downside protection in the short term while still allowing some upside potential. ITM call writing can provide greater short-term protection, but will allow very little, if any, upside.
- Easily modified. Covered call writes are easily closed or modified once implemented by executing an offsetting transaction.
- Generates income. Call writes generate cash flow on holdings that can be withdrawn, used to purchase other investments, or compounded.
- Flexible use. Call writes can be used intermittently or as an ongoing strategy.
- Used in more complex strategies. Call writing is often used in more complex strategies to help offset the price of other options (discussed further in Chapter 7).
- Disadvantages
- Limited upside. Upside potential is capped for the duration of the option, unless the option is closed or rolled.
- Partial protection. Call writing only protects the downside risk of the underlying instrument to the extent of the option premium received.
- Requires attention. Effective covered writing requires monitoring positions more closely and potentially executing follow-up transactions.
- False security. Call writing can provide a false sense of security for those who do not embrace the fact that the underlying stock position still has substantial risk.
- Introduces additional behavioral considerations. Call writing may result in a loss on the option sold. Even though the gain on the stock would be greater, taking a loss on the option is sometimes emotionally difficult. (This is discussed further in Chapter 4.)
OPTIONS FOR VOLATILE MARKETS : Chapter 3: The Basics of Covered Call Writing : Tag: Options : Stock, Strike Price, Expiration, Volatility, Interest Rates, Strategy, Institutional - Major Factors Affecting Call-Writing Returns
Options |