Mind of the Market from Candlestick
Single candlestick patterns, Types of candlesticks, Powerful candlestick patterns, Types of candlesticks, Candlestick chart analysis, Bearish candlestick patterns
Course: [ Uses of Candlestick Charts : Chapter 2. The State Of Mind Of The Market from candlestick ]
Pattern recognition is a cornerstone of technical analysis. Western practitioners have been spotting things like Dow Theory signals, and all sorts of patterns with names like Rounded Bottom and Head & Shoulders, for years.
What Candles Tell Us About The State Of Mind Of The Market
Marabuzo v Doji Candles
Pattern
recognition is a cornerstone of technical analysis. Western practitioners have
been spotting things like Dow Theory signals, and all sorts of patterns with
names like Rounded Bottom and Head & Shoulders, for years. This is why
viewing candlestick charts can be an easy transition for technical analysts,
because it’s a similar practice: you look for recurring patterns, and use the
assumption that price patterns repeat themselves, so similar behaviour will be
seen after these price patterns when they occur in the future.
Let’s
begin our journey into pattern recognition of candlestick charts.
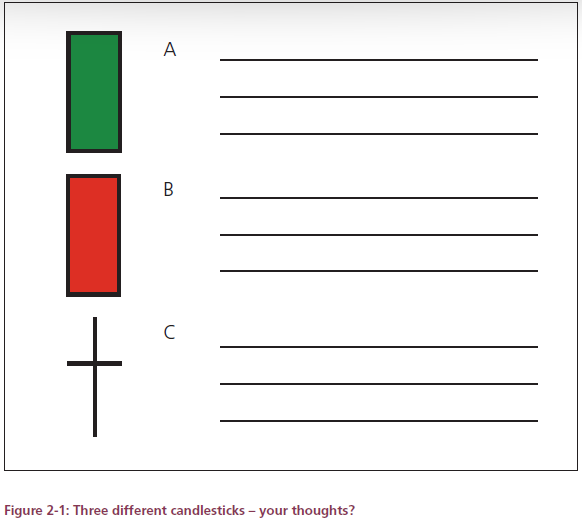
Look at
the three candlesticks in the following figure, and in the space next to them
jot down what happened to give us such a shaped candle.
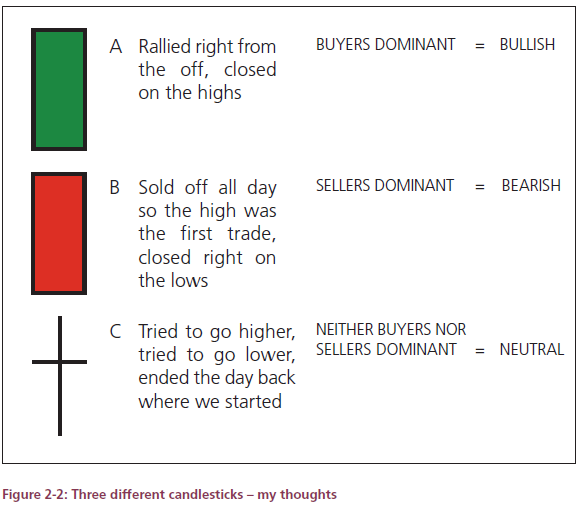
Hopefully
you jotted down something along these lines:
In
candlestick A the market rallied from the first trade, and closed on the day’s
high.
In
pattern B traders spent all day selling off. The high was the first trade of
the day, and the low was the last trade.
In
pattern C the market opened and closed at the same price, having tried to move
higher then lower (or vice versa) over the course of the day.
The next
step is to think about the state of mind of the market on each of these very
different sessions, and in turn we can get a feel for market sentiment, at
least for that particular session.
Some
simple assumptions can now be made. If the buyers were still active on the
close of candlestick A, is it likely that they may still want to buy some more
tomorrow when the market re-opens? If they were buying as the market closed it
could be argued that they haven’t finished. It was only the market closing that
stopped them from buying more.
If the
sellers were active and dominant right up until the last second of trading on
candlestick B, are they suddenly going to disappear into the ether when things
start again the next day? Unlikely!
On day C
no one could make up his or her mind. For a while the bulls were winning, but
then the sellers appeared, and the market sold off. But this selling didn’t
last, and by the close the market was right back where it started. If the
buyers and sellers were equal to each other either confusion reigned supreme
over the session, or indifference led to a “nothing” day.
Or it
could have been an almighty ding-dong dust up between buyers and sellers, but
no one won in the end - the equivalent of a boxing match being tied after 12
bruising rounds.
In
candlestick analysis most patterns are given a name, and the three patterns we
have looked at are no exception.
The first
two are sessions where there is a strong push in one direction.
A
candlestick with a long real body and very little in the way of shadows is
called a Marabuzo.
Marabuzo
is the Japanese word for “shaven head”, so it’s descriptive of the look of the
candlestick; with very little shadow showing up - it definitely can look like a
candle that’s had a severe haircut!
In my
research I’ve come across a couple of alternative spellings, the most common
being Marubozu. I have also come across this being described as “formed with
only two prices” which is quite clever, when you look at the formation of these
patterns.
A bullish
Marabuzo is a strong conviction day in favour of the buyers: a big open
candlestick.
A bearish
Marabuzo is a candlestick that’s mostly made up of filled real body: bearish
domination.
This sort
of session is the purest form of continuation pattern, as an assumption can be
made (as mentioned earlier) that the market will carry on in the same direction
after such a strong conviction day.
Our third
candlestick has no real body at all, due to the fact that the market opened and
closed at almost exactly the same level.
A candlestick
with no (or a very small) real body is known as a Doji.
We will
look at the Doji candlestick in more detail in the next chapter, because it is
a powerful reversal pattern.
In a
strong uptrend the buyers are dominating almost daily. If you suddenly get a
Doji day this means the bulls didn’t dominate - if you take the day as a whole,
they were totally matched by the bears; hence the market ended up back where it
started. This is a change from what went on before.
The same can be said for a Doji that appears in a down trending market: a Doji shows that the bears may be struggling to sustain their push to lower prices, and therefore a reversal may be occurring.
Uses of Candlestick Charts : Chapter 2. The State Of Mind Of The Market from candlestick : Tag: Candlestick Trading, Forex : Single candlestick patterns, Types of candlesticks, Powerful candlestick patterns, Types of candlesticks, Candlestick chart analysis, Bearish candlestick patterns - Mind of the Market from Candlestick
