Single Reversal Patterns
Single candlestick patterns, Types of candlesticks, Powerful candlestick patterns, Types of candlesticks, Candlestick chart analysis, Bearish candlestick patterns
Course: [ Uses of Candlestick Charts : Chapter 3. Single Reversal Patterns ]
The first pattern we’re going to look at is the Hammer. This is a rare treat in candlestick analysis: a pattern that looks like its name!. A Hammer looks like a hammer, with a small fat head and a long handle.
An in depth look at the Hammer to see why
this is a reversal signal, and such a strong one!
Hammer
The first
pattern we’re going to look at is the Hammer. This is a rare treat in
candlestick analysis: a pattern that looks like its name!
A Hammer
looks like a hammer, with a small fat head and a long handle.
With
every candlestick pattern in the following chapters I’m going to put the set of
rules for each pattern in a highlighted box, for easy reference. You may have
already noticed the “Cheat Sheet” on the inside covers of this book - this will
hopefully become your first point of reference once you’ve finished reading the
main chapters.
Chapter summary
This is
the crux of candlestick analysis: by looking at the shape of any candlestick we
can surmise what’s happened over that time period. We can then make assumptions
on the balance of power between bulls and bears, and on those assumptions
decide whether this balance is starting to tip the other way.
Trading
and charting the markets can be classed as an exercise in playing the odds. If
you can effectively and successfully gauge market direction you are already
doing better than merely flicking a coin (which is akin to many people’s
decision making process!)
Now we’ll
go through some of the more common and more powerful reversal patterns and work
out why they’re classed as reversals.
Rules
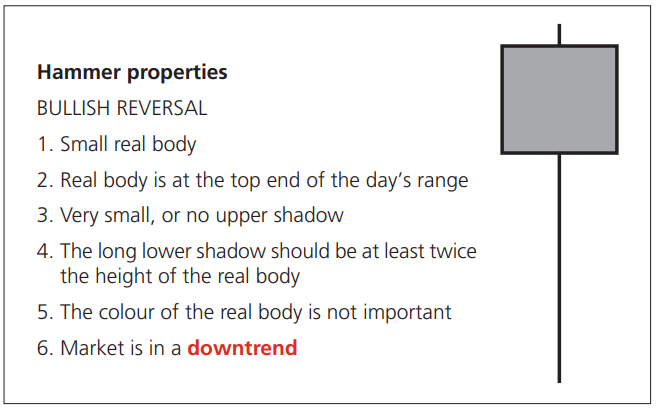
Construction
Let’s
expand on the above, just to make sure everything’s clear. Think about our
Doji: this was the result of an open and close at similar levels - an even
balance between bulls and bears. The Hammer has a small real body, so with this
pattern we have the same thing - a pretty even balance between buyers and
sellers. This is also the reason why the colour of the real body isn’t
important; it’s the size of the real body that’s important. We’ll talk about
this a bit more later on.
The small
real body is at the top end of the day’s range, so there is not much happening
above the top of the real body. This leaves us with a lot of lower shadow, and
as I’ve said in the box above this should be at least twice the measurement of
the real body. I’m never sure whether to say twice the height or twice the
length, but hopefully you’ve got the idea. Most charting systems have a cursor
functionality where you can check the open, high, low and close of the
candlestick if you put your cursor over it - you can use this function to check
if it qualifies.
The final
condition is very important and, unfortunately, often forgotten. Remember we’re
looking at a reversal pattern here, so the market needs something to reverse.
Only if we see this shape of candlestick in a falling market can we call it a
Hammer.
There is
a name for this shape of candlestick in a rising market (the Hanging Man), but
it’s not as strong a reversal signal as a Hammer and, anyway, we’re going to
look at it later on in this chapter.
The fact
is, the Hammer is an extremely potent reversal pattern and one of the simplest
to understand, which is why we’ll spend a bit of time on it. As you can see
from the following chart it certainly did a good job in this instance. This was
the August 2007 subprime sell- off in the Dow - the first time it hit the fan
anyway!
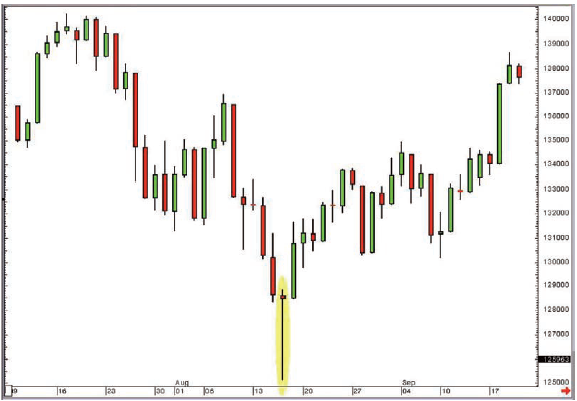
Figure 3-1: Dow Jones Industrial
Average; daily candlestick chart; 10 July 2007 - 20 September 2007, showing 16
August 2007 Hammer
We can
see clearly from this chart that the Hammer candlestick did indeed call an end
to the selling, and from here the market rallied strongly, only returning to
these levels months later.
Getting inside the pattern
Why is a
candlestick shaped like this such an important reversal? To answer this
question we need to think about the price action that goes into the formation
of a candlestick of this shape.
The best
way to do this is to zoom in on that particular day and see what actually
happened over the session, but while we do this we should also keep in mind
that the daily chart only requires four pieces of data: the open, high, low and
close on that day.
Below is
a 10-minute candle chart for the Dow Jones Industrial Average on 16 August
2007. We have added to the chart the general direction of travel, joining up
the day’s open, low, high and close.
We have
cut the day into small 10-minute segments and the following chart shows the
direction of travel taken if we split the price action down into these small
parts.
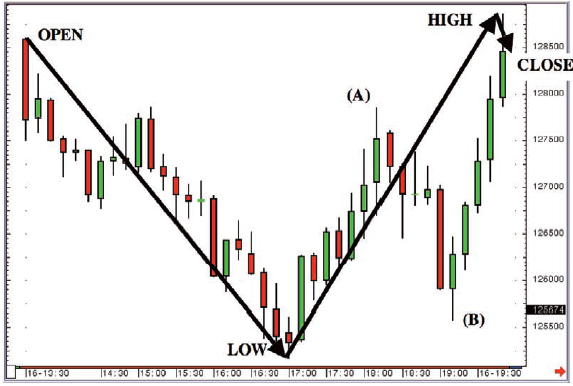
Figure 3-2: Dow Jones Industrial
Average; 10-minute candlestick chart for 16 August 2007
You can
see that on this day the market sold off dramatically - over 300 points in the
first 4 hours of trade - but then rallied strongly and took back all of the
earlier losses, closing the session right back at the highs. What a
roller-coaster ride!
So that’s
what happens on a Hammer day. It’s clear as a bell if you look at the previous
chart:
The market sold off sharply, then hit a
price where the selling stopped and the buyers took over. From here the market
rallied strongly and ended up right back where it started. It also closed near
the high, which is important, because quite often a sell off in late trade can
spoil the party. But in this case the gains seen in the second half of the
session were sustained into the close.
It could have been so different
You can
see that the bears had another go in afternoon trade on this particular day -
the sell off between the points marked A and B on our chart. But the bulls
reacted once more to this weakness and the market rallied late on and closed
strongly, leaving us overall with a “V” shaped direction of travel.
So a
Hammer on the daily chart represents a “V” shaped direction of travel over the
course of the day as a whole.
Psychology
Let’s
think about our bulls and bears and their mindset at each point of the day. At
the start when the markets begin to sell off no one is surprised, are they?
After all, the market is experiencing some selling off, which is something
we’re quite used to happening when you consider the market is in a downtrend.
Right up until the moment the market hit the low the bears are in charge, and
they’re probably very pleased with themselves. They’ve been bossing things of
late, and today they’re just doing more of the same.
Imagine,
with this level of complacency, how uncomfortable the afternoon suddenly
becomes for the bears with each tick higher. And they don’t get the chance to
get out either, because there isn’t any pullback on the close to cover
positions on. They keep thinking the market’s going to fall over again and they
can cash in some chips, but this sell- off doesn’t come.
The bulls
on the other hand, are suddenly feeling empowered, after all they’re now having
a good day (compared to how they were doing when the market was on the low),
which isn’t something they’ve been able to say much of late!
Who goes
home happier that night? I think the bulls, because finally they’ve had a good
day. Things are certainly a lot better for them now than they were when the
market hit that low earlier in the session.
The bears
will have seen their profits diminished; they’re not particularly used to this
just lately, and they won’t like it. They may well stew on it overnight, then
come in tomorrow, swallow their pride, and cover their shorts (becoming buyers
in the process). They may even decide that if you can’t beat them, join them,
and they’ll become outright bulls.
Hopefully
this gives some insight into why this sort of session can be so important and
trend changing. A Hammer represents a session where things change. Where the
sellers drop the ball, where the buyers suddenly wake up and where the balance
of power shifts from the sellers to the buyers.
In other
words, when you see a Hammer, instead of thinking that this may signal a
reversal (future tense), think of it as a sign that there has already been a
change of direction (in the second half of the session), and now the question
is whether this can be sustained, and whether it can turn into a solid change
of direction for the market you’re viewing.
Examples
Now I’m
going to roll out one of my all time favourite charts; a weekly candlestick
chart for the EUR/USD Forex cross, dating back to 1999. This was just a couple
of years into the unified currency, when the euro was almost being classed as a
laughing stock.
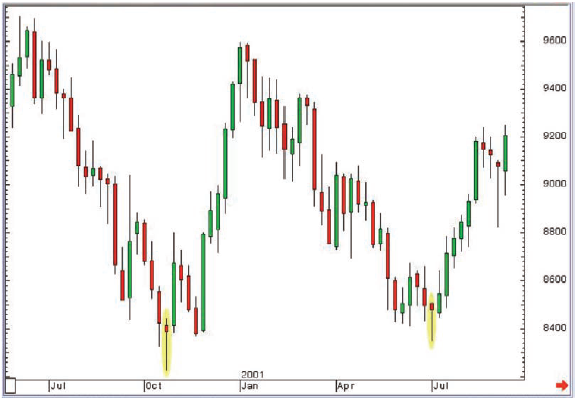
Figure 3-3: Euro vs. US Dollar Forex
Cross; weekly candlestick chart; 29 May 2000 - 10 September 2001
So just
to set the scene this is a weekly chart. The open of each candle is the first
trade on the Forex markets on a Monday morning in Asia. The close is the last
print on Friday night in the US.
As you
can see, the market finished each big down-leg with a Hammer candlestick, which
is all very nice, and suggests that these patterns are the best thing since
sliced bread.
Except
that’s not why I’ve shown you this chart. I want you to take a closer look and
find two more Hammers on the chart.
They
appear halfway down the first move, both together, at the end of August 2000.
The first week of September turned out to be one of the worst weeks for the
euro on the whole chart. In other words our two Hammers didn’t work. They were
without doubt the worst possible signals of a reversal.
If you
had a trading system based on buying the market on appearance of a Hammer on
this chart, you would have been stopped out by the time the good signals came
along. In fact you’d probably have abandoned the strategy altogether by then,
if you had any money left!
One
lesson we can learn from this is that we should never have a decision-making
process based purely on one candlestick pattern being posted. This is common
sense, surely. When you buy a jumper do you have one criterion, ie, “it must be
red”, and do you go out and buy the first red jumper you see? Or do you also
want to have a certain type of neck, and a specific style, and a particular
material or texture? Of course you do!
This is
where academics get it all wrong where technical analysis is concerned. To put
it in simple terms they look at something like candlestick analysis and say “we
tested 500 occurrences of a Hammer and only 100 gave us a 300 point rally after
they appeared, therefore candlesticks are rubbish.” Thanks for nothing.
Academics don’t generally wear very nice jumpers, do they? Whereas technical
analysts, in the main, are a well dressed bunch (myself apart!).
Look at Figure 3.4. Candlesticks B, C,
D and G all qualify as Hammers.
B and C
are the failed patterns that I’ve talked about above, but it’s pretty clear to
see that patterns D and G did a good job in calling a reversal. Or did they?
If you
had used the filter of needing a green candle straight after a Hammer to give
you a buy signal you would have refrained from taking buy signals at B and C,
which would have turned out to be very good decisions. More to follow on this.
But you
would have taken the signal after candlestick D at the end of the green candle
straight after the Hammer, and then would have suffered three straight weeks of
losses. In fact I’m pretty sure I would have stopped myself out at some point
during those three weeks. I hope so anyway.
After
Hammer G you would have waited for a green candle then bought, and made a tidy
profit. No issues with this one at all.
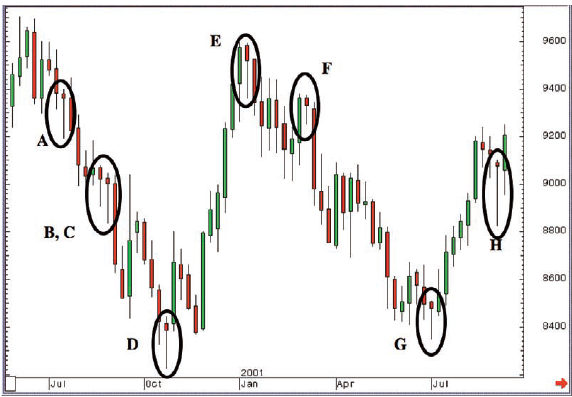
Figure 3-4: Euro vs. US Dollar Forex
Cross; weekly candlestick chart; 29 May 2000 - 10 September 2001 with
annotations
So am I
trying to say that this is great because it works 25% of the time? No, actually
it worked 75% of the time in this case, if you had waited for a subsequent
qualifying green candle.
Why 75%?
Because many of the best traders in the world will tell you that saving money,
and stopping yourself from making a bad trade, is as important as making money.
If you read interviews with top traders, such as those in Jack Schwager’s
Market Wizards, you’ll see repeated references to preservation of capital. This
introduces something important to our usage of candlestick analysis that we
haven’t even considered yet: candlesticks
can be used to stay out of bad trades as well as to get you into good trades.
Negative selection
Candlesticks
can be used for negative selection. What does this mean? If you’d been watching
this down-move with a view to waiting for an opportunity to get long, you would
have saved yourself a lot of pain, misery and money by waiting for two criteria
to be established: a bullish Hammer and a subsequent confirming candlestick. So
you had a strategy to get you into good trades as well as keep you out of bad
ones; to deselect or negatively select those that needed staying away from.
In the case of this
chart we can take it a step further and redefine our criteria to give us better
trade opportunities. We can say that if the market moves above the high from
the Hammer week, then we will go long. With this filter we would still stay out
of the market after candles B and C (a sigh of relief once again), get into the
long trade much earlier after the Hammer D (nice), and get in slightly earlier
after Candle G (still nice). Suddenly, just by applying a simple filter we have
a powerful tool to help us spot not just when trends are changing, but also
when they’re not!
This introduces another factor to the
equation: each chart will be different, and you should never treat any two
charts the same. Yes, a Hammer is often a strong reversal pattern, but what you
do with it can change from chart to chart.
This is
in spite of the fact that one of the assumptions we make as technical analysts
is that price action is repetitive; if something’s happened many times before
in a particular stock or security, we can assume it will probably happen in a
similar way in the future. In the example above we worked out that looking for
Hammers then waiting for a move through the Hammer’s high would provide the
most robust and timely signals over the life of this particular chart. We can
now apply this set of rules to the same chart in future, making the assumption
that market action is repetitive.
Obviously
this isn’t a guarantee that it will work out, but it stacks the odds in your
favour. Back testing is the name given to this exercise; going back in time to
see what worked well before, so that you can apply this in the future. I often
give seminars and talks where people gaze at me waiting to be given the Answer.
Clearly if I had the Answer I’d be in the Bahamas on my yacht, keeping the
Answer to myself. Unfortunately the answer to becoming a successful analyst or
trader is hard work, which in this case involves the back testing of patterns
to see if they’ve done the job before.
In the
following pages I’ve posted several examples of Hammers that have given us a
low, or at least a good bounce. As you can see they don’t all look exactly the
same, and sometimes they don’t actually appear right on the day the market
bottoms out.
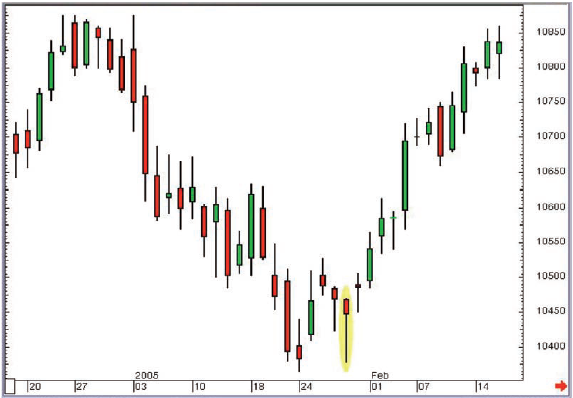
Figure 3-5: CBOT Dow futures
(unadjusted active continuation); daily candlestick chart; 17 December 2004 -
16 February 2005, showing 28 January 2005 Hammer
Note how
the Hammer pattern in Figure 3-5 didn’t actually define the low of the move,
but formed a secondary low that held the support level created by the low four
days earlier.
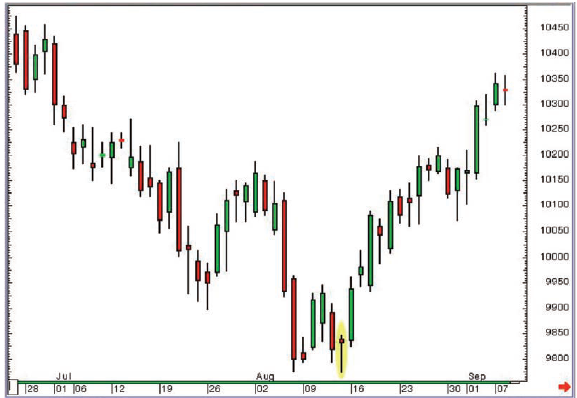
Figure 3-6: CBOT
Dow futures (unadjusted active continuation); daily candlestick chart; 25nJune
2004 – 8 September 2004, showing 13 August 2004 Hammer
Another
one where support was found at a support level from a few days earlier.
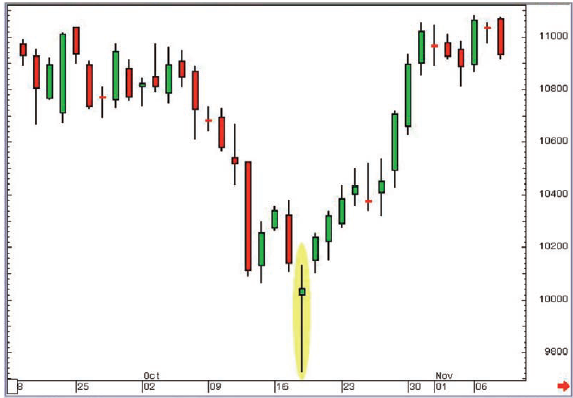
Figure 3-7: CBOT Dow futures
(unadjusted active continuation); daily candlestick chart; 19 September 2000 -
8 November 2000, showing 18 October 2000 Hammer
A
slightly odd looking example, but still a Hammer, and still a good reversal
signal, as it turned out.
The colour of the real body on a Hammer
Finally,
let’s address a question that’s often asked when it comes to this sort of
single candlestick patterns: does it matter about the colour of the real body?
No is the answer, and hopefully Figure 3-8 shows why it doesn’t.
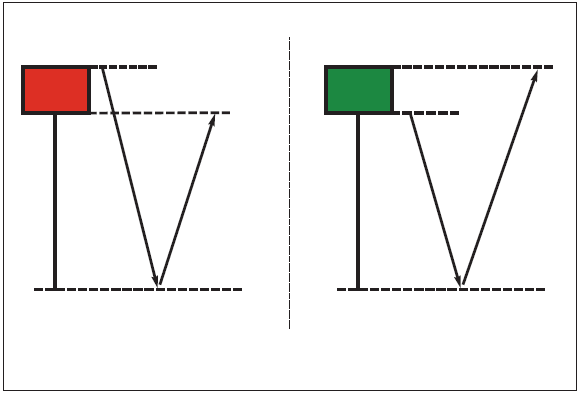
Figure 3-8: Red bodied and green bodied
Hammers; any real difference in the message?
As you
can see, in both cases the market sold off a long way, then came back a long
way. Does it really matter in which order the open and close come? The fact is
the bulls recovered from a pretty horrendous start to the day.
So no,
the colour of the real body doesn’t matter when it comes to the Hammer. Of
course there may be a slight psychological edge ascribed to a green-bodied
Hammer, as the trading at the end of the day managed to surpass the opening
value, but in my experience the market makes very little differentiation
between red and green real bodies on this pattern.
It’s the
length of the lower shadow that is probably more important, followed by what
happens in the days after the Hammer is posted.
Hammer summary
A Hammer
is a single candle reversal pattern that’s found in a market that has been
falling, with a small real body at the top end of the candle’s range, which
leaves a long lower shadow.
The
Hammer is one of my favourite reversal patterns, whatever the time frame of the
chart being viewed. I have found them to be particularly effective on liquid
exchange-traded futures contracts like T-Notes, Bunds, the DAX Index and Gold,
especially when viewing short-term time frames like 10-minute or 30-minute
charts.
Later on
when I expand upon different time frames we will see plenty more examples of
Hammers. It really is an amazingly effective and powerful reversal pattern when
used in the correct way!
Uses of Candlestick Charts : Chapter 3. Single Reversal Patterns : Tag: Candlestick Trading, Forex : Single candlestick patterns, Types of candlesticks, Powerful candlestick patterns, Types of candlesticks, Candlestick chart analysis, Bearish candlestick patterns - Single Reversal Patterns