Rising/Falling Three Method and gaps Method
What is a gap, gap trading strategy, gap trading forex, gap trading stocks, gap forex, forex weekend gap, gap in forex chart
Course: [ Uses of Candlestick Charts : Chapter 5. Continuation Patterns ]
Our voyage of discovery has so far concentrated purely on patterns that suggest the market may be turning over or reversing. These are the most powerful patterns in candlesticks but they are by no means the be all and end all.
Rising/Falling Three Method and gaps
Introduction
Our
voyage of discovery has so far concentrated purely on patterns that suggest the
market may be turning over or reversing. These are the most powerful patterns
in candlesticks but they are by no means the be all and end all. There are a
bunch of patterns that signal a continuation of a trend, indicating that things
have taken a temporary pause for breath before continuing on their merry way.
This is often a difficult thing to decide: is a market merely retracing, or are
we seeing a reversal? This is why I always ask for a bit more confirmation of
any reversal pattern. The old phrase “one swallow doesn’t make a summer” is
quite relevant to candlestick analysis, I’ve always felt.
We’ve
already, in the previous chapter, explored the use of Marabuzo lines to confirm
or question any potential reversal. I personally like to also use things like a
trend line or a reliable moving average; this is something we’ll explore a bit
later.
I don’t
want to spend too much time on continuation patterns because I’ve always found
them to be rather obvious, especially once you are proficient at the exercise
of getting inside the components of the individual candles you’re viewing. To
prove this point I’ve chosen the “rising/falling three” pattern as the topic of
this section.
Falling or Rising Three Method
A Rising
Three pattern is a continuation pattern in a falling market, where you see
three small candles rising within the range of a previous red real body. In
other words you see one great big down day followed by three rather meek up
sessions, but the rises seen collectively over the three sessions don’t do
enough to repair the damage done on the first day. We’re not quite done with
this pattern because a fifth candlestick is needed to complete the picture:
another big red candle that signals a resumption of the down move after our
three counter trend candles.
So, a
five candle pattern then! Wow! However, the psychology is, I think you’ll
agree, pretty simple to follow. We have a market that’s in a downtrend and day
one is just another typical session, dominated by the bears. Three days are
then spent with prices gently nudging higher, but not with any real conviction.
This
could be the result of some short covering. Or it could be that the big red
candle was the result of a big bit of news, which was swiftly followed by a few
days of calm after the storm reflection. Generally the market’s first reaction
to news flow is pretty reliable though, and after a few days of pondering, the
realisation hits that this thing really needs selling again! The fifth day is
the day that the market realises that the middle three sessions haven’t made
any real difference even if there has been some sort of recovery. Another big
red candle proves that the bears are back in the box seat.
The
Falling Three is the opposite, and is to do with the bulls taking a breather in
an uptrend. As long as major support levels don’t crack there’s a good chance
that the bulls will be reinvigorated at some point; after three days of sitting
on the sidelines they decide enough is enough, and pile back in. The chart in
Figure 5-1 shows an example of such a pause for breath on an intra-day chart.
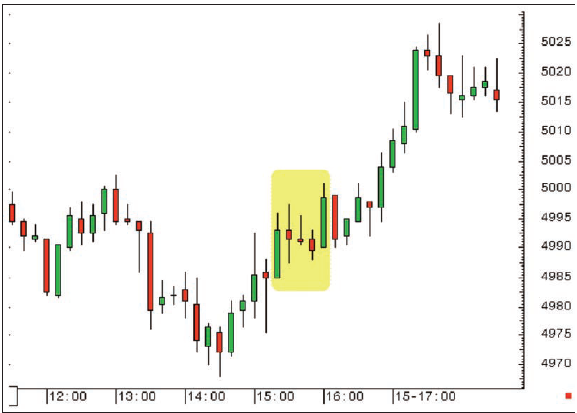
Figure 5-1: CAC 40 futures (May 2008);
10-minute candlestick chart; 15 May 2008, 10.30am - 5.50pm
Gaps (or windows, to use the candlestick parlance)
What is a gap?
Even
before I discovered candlesticks I always used to look at gaps, and I am a firm
believer that they’re something that cannot be ignored, particularly for day
traders. While they’re not strictly a continuation pattern, I do believe that
they are best used to find support in an established uptrend and resistance in
a down move, and in doing so they do a nice job of flagging a market that’s
happy to continue the trend it’s in.
I will
stick with what I’m used to, and continue to talk about gaps for this section,
even though the traditional candlestick name is a “window”.
A gap,
quite simply, is an area of price at which no trade has taken place due to
exceptionally strong, or exceptionally weak opens.
An open
above the previous day’s high creates a gap, and the previous day’s high
becomes gap support.
If, on
the other hand, a market receives bad news and opens below the previous
candle’s low an upside gap is created (above the market) with gap resistance
set at the top of the area of no trade, ie, at the low of the previous day’s
candle.
There are
quite a few rules that I’ve heard over the years pertaining to gaps. For
example, I have heard many times the theory that 80% of all gaps get filled
within four days of their creation. In other words the market invariably goes
back down to a gap support, or returns higher to a gap resistance, shortly
after the gap appears.
In
certain markets (one that springs to mind is Bund), you hear people say “it
always fills the gap”. A backtest shows this to be very close to the truth,
although not 100%.
This
book, being a broad brush introduction, will not go into the nuts and bolts of
testing theories in this way. There has been plenty of testing done, with
various degrees of reality involved, and it’s a huge subject.
Instead
what I will say is that gaps usually create quite a stir, and are often strong
reference points, especially for those trading short-term time frames.
Why are gaps so important as a continuation signal in an uptrend?
If you
open strongly and leave a gap below you have an instant support level. The
bulls have a strong line in the sand and often buyers will put bids in at or
ahead of the gap to try and gain good trade entry at what should be a key
juncture.
If you
gap higher in a solid uptrend this presents a potential “buy on a dip”
opportunity in line with the trend, and therefore it has a better chance of
doing its job.
If, again
during an uptrend, the market falls through a gap, then maybe the bulls aren’t
as powerful as the overall trend suggests: maybe things are changing.
If you
think about the Dark Cloud Cover formation and (not necessarily always, but
quite often) the Bearish Engulfing Pattern, it is often the failure to hold the
overnight gap that is the first sign of trouble. Obviously to form these
patterns the bears have to do more work once they’ve taken us through the
overnight gap support, but at least you’re already alert to the possibility
that things are weakening.
Gaps in a downtrending market
If a
market opens below the previous day’s low there is a gap to fill to the upside.
The dominant bears often line up to sell at or just in front of this level, so
you can see how the resistance is created.
A
downtrending market that stays below an upside gap is showing its lack of
upside conviction and proves that the bear tack should be stuck with. The
market just doesn’t want to go up.
If a
security has been dropping sharply and gaps have been left to the upside then
every time one of these key resistance levels is retaken on any subsequent
rally the bulls have reason to cheer. It’s something akin to a list of black
marks being removed from the copybook.
So, as
with Marabuzo lines, gaps are a simple yet highly effective way of gleaning
support and resistance levels from our charts, and in turn the market’s mood
can be gauged, depending on whether these levels are holding or breaking.
This is
particularly important in candlestick analysis because it is inherently a
contrarian form of analysis. Spotting reversal patterns is key, so you need to
see some confirmation after such a pattern. The immediate reaction to a
reversal is to ask the market to “prove it!”
The traditional Western view on gaps
In Western analysis it’s often
suggested that there are different types of gap:
1. A breakaway gap signalling the start of a move
2. A measuring gap seen halfway through a trend (if you know where halfway is you can measure where the end should or could be)
3. An exhaustion gap, seen when a powerful trend (particularly an uptrend) is ending.
I like two out of the three of these.
Let’s go through them one by one to see why.
In my
trading lifetime I have seen many breakaway gaps. I can also see the logic
behind it, or the psychology if we want to stick to the underlying theme of
this book. Often a stock goes on a run because someone tips it in the weekend
press, or a strong piece of fundamental news is released, such as a
pharmaceutical company getting approval for a new drug or a mining company
striking a new vein, or a company receiving a takeover approach. All of these
things can cause a market to gap higher and trigger the start of a bull run.
Similarly
a breakaway gap can be seen at the start of a downtrend if a stock is
downgraded, or if a bid is pulled, or if a drug is kyboshed by the FDA!
Exhaustion
gaps are often seen at the end of big moves, when the market is entering the
“silly season” stage; if these gaps start to show, you can instantly allow the
alarm bells to start ringing. However, it is really only in retrospect that you
can definitively label these as exhaustion gaps. At the time they may have that
look and feel, but they are quite tough to trade, as you’re batting against a
strong move.
You only
have to hear some of the rubbish that’s written about markets when they’re
steaming higher. At the top of the dotcom bubble in 2000 your plumber was
giving stock recommendations. “You can’t lose” is a phrase that starts getting
bandied about. Of course an old adage that makes far more sense is the one
about “if it sounds too good to be true, it probably is.”
Anyway,
as soon as this sort of thing is occurring at a high, it’s a sign that silly
season has definitely arrived; the mania type buying is going to dry up quickly
and the market will fall over very fast at some point. Sanity will be restored
some time soon in the shape of a big reversal - a down-move that, at the very
least, restores things to more sensible levels and gets rid of the froth.
Measuring,
or halfway, gaps I just don’t get. I also haven’t seen much evidence of them,
even if I haven’t spent years religiously backtesting them. For the sake of
completion, despite my dismissal a measuring gap is said to be seen at the mid
point of a move. Once you know where the middle is, you can measure where the
end could be.
Example
Below is one chart that will
demonstrate many of the points discussed.
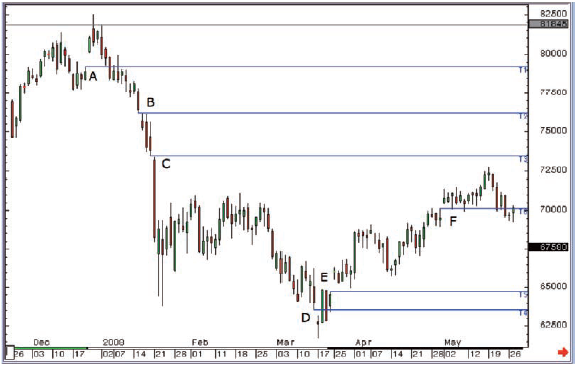
Figure 5-2: Eurex DAX futures
(unadjusted continuation); daily candlestick chart; 26 November 2007 - 27 May
2008
It could
be argued that the gap at point A was an exhaustion gap. But how would an
observer know that at the time? It wouldn’t be possible because it’s only in
hindsight that it can be classed as an exhaustion gap. But at the time all we
know is that it should be a strong support on any pullbacks, and if the market
fails to hold the gap on the way back down we get a hint of what’s to come.
Sure enough, once this gap failed to hold there was not much upside, and it was
at this point it became apparent that it could have been an exhaustion deal. On
the subsequent down move the market left a couple of gaps at B and C, and the
day after gap C posted an enormous down day.
The gap
at point D turned out to be an exhaustion gap for the downside move. It was
bang in the middle of a Morning Star formation and a few days later the market
gapped higher at point E. This gap held on a sell-off a few days later and
provided a nice buying opportunity if you were looking for such a move on the
back of the Morning Star.
At point
F there was another gap that held on a couple of subsequent occasions in the
ensuing weeks.
So you
can see that gaps can signal the end or the beginning of trends, but the thing
I really like is when they’re in line with the unfolding trend. If you had sold
the market on the open after gaps B and C, with a stop order above the gap, you
would have had a trade with excellent risk/reward and a clear line in the sand
to reference as far as getting out was concerned.
Chapter summary
Gaps can
be extremely important reference points, and in my experience they work very
well when seen in line with a firm trend, except in conditions where the market
is capitulating, in which case they can be used as a warning of a potential
reversal.
Often you
will see a reversal pattern at an extreme after the market has left a gap or
two. The gaps can be good reference points subsequently, to be used as
confirmation of the reversals.
Uses of Candlestick Charts : Chapter 5. Continuation Patterns : Tag: Candlestick Pattern Trading, Forex : What is a gap, gap trading strategy, gap trading forex, gap trading stocks, gap forex, forex weekend gap, gap in forex chart - Rising/Falling Three Method and gaps Method
