Morning Star Pattern
morning star candlestick, morning star candle, morning star candlestick pattern, morning doji star, morning star candle pattern, morningstar pattern
Course: [ Uses of Candlestick Charts : Chapter 4. Multiple Reversal Patterns ]
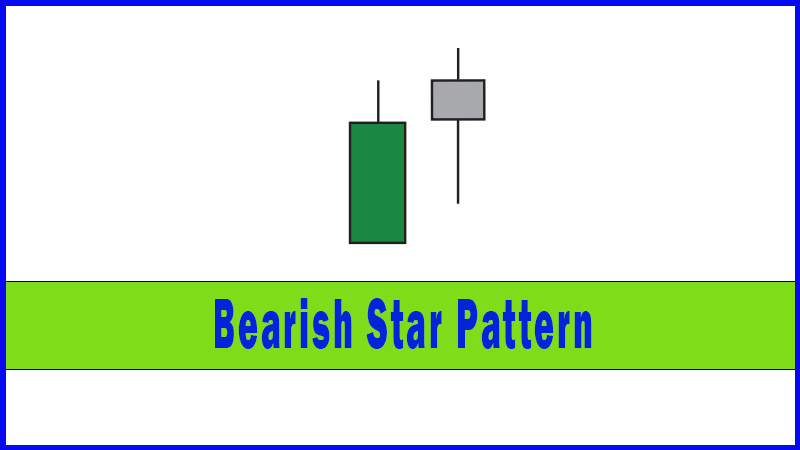
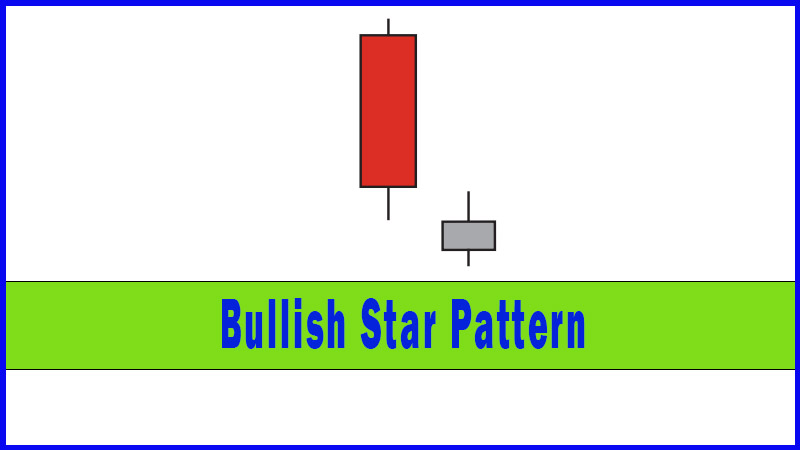
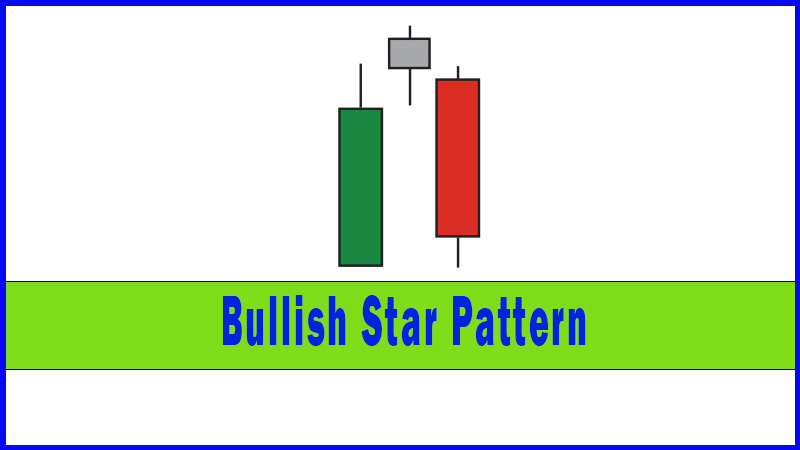
It’s a pretty simple step to go from a Bullish Star to a Morning Star: you just need a nice big open candle to make it a three candle pattern - the third day confirms the suspicions aroused when the market stopped travelling relentlessly lower the previous day (the middle day of the three).
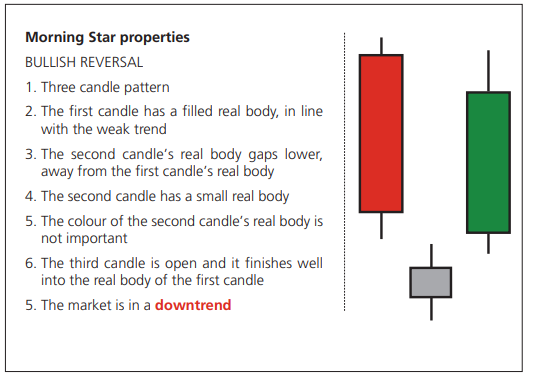
Morning Star properties
It’s a
pretty simple step to go from a Bullish Star to a Morning Star: you just need a
nice big open candle to make it a three candle pattern - the third day confirms
the suspicions aroused when the market stopped travelling relentlessly lower
the previous day (the middle day of the three).
The
buyers are back in town, and day two was the definitive turning point. The
market has moved in a “V” shape over the three days. It’s all change.
As I said
with the Evening Star, this is a particularly potent pattern according to the
Japanese, and you can see why. There are lots of components that need to come
together, and ticking all the boxes requires a pretty serious turnaround in the
market’s fortunes.
Third day flexibility
I’ve
always subscribed to the view that the starting point of the third day is of
far less importance than where it ends, so I don’t worry about whether the
market gaps higher on the third session. Instead, only the condition of closing
well into the real body of the first day needs to be satisfied (that word
Marabuzo comes into play once more).
So Figure
4-16 below shows an ideal scenario Morning Star, and Figure 4-17 shows a
variation that we’d be happy to label as such.
Examples
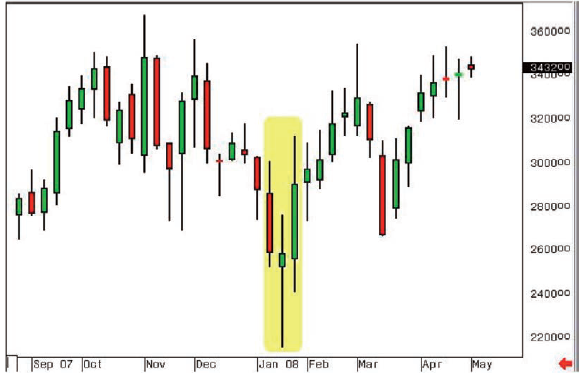
Figure 4-16: Anglo American pic; weekly
candlestick chart; 28 August 2007 - 28 April 2008, showing Morning Star pattern
between 14 January and 1 February 2008
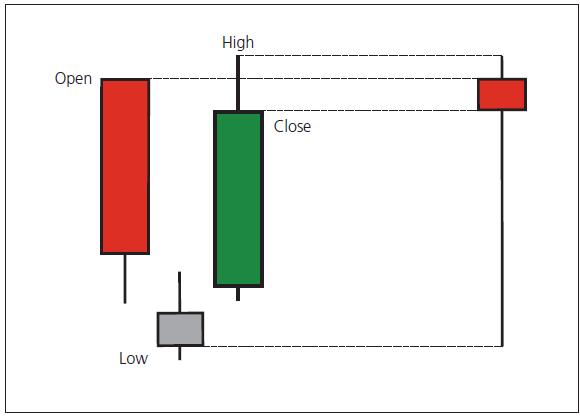
Figure 4-18: Three candles that make up
a Morning Star - when merged together they form a Hammer
Morning Star summary
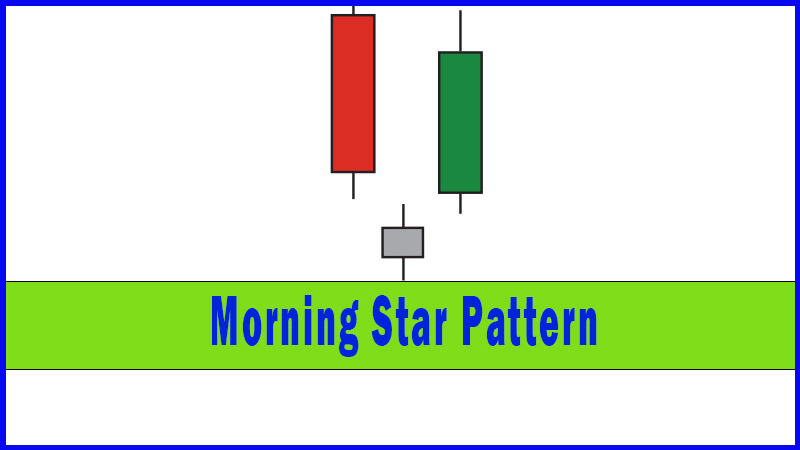
The three
candles that form a Morning Star make a potent argument for the reversal of an
established downtrend. The first candle has a large filled real body just like
many of the other sessions that we’ve seen during the downtrend. Day two starts
off with further weakness but then nothing really happens. After this questions
should be asked as to the sustainability of the down-move. Day three answers
these questions. A big open candle tells us the bulls are back in town.
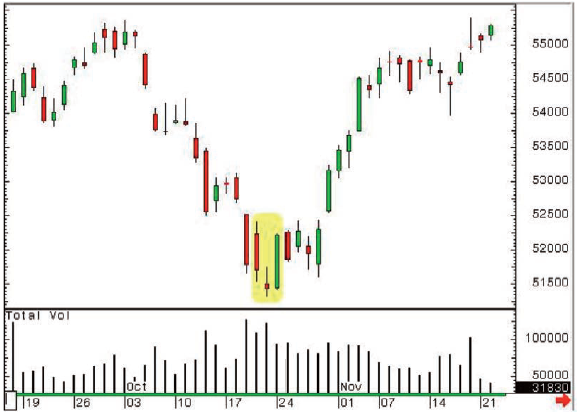
Figure 4-17: FTSE futures (unadjusted
continuation); daily candlestick chart; 16 Sep 2005 - 22 Nov 2005, showing
Morning Star variation on 20, 21 and 24 October 2005
Combining the Morning Star
Again we
would pose the question of what these three candles would become if you were to
condense them all together into one? Hopefully you can see how price action
that takes on a “V” shape can form a reversal pattern however long it takes, be
it one day or three days. The following illustration shows this clearly.
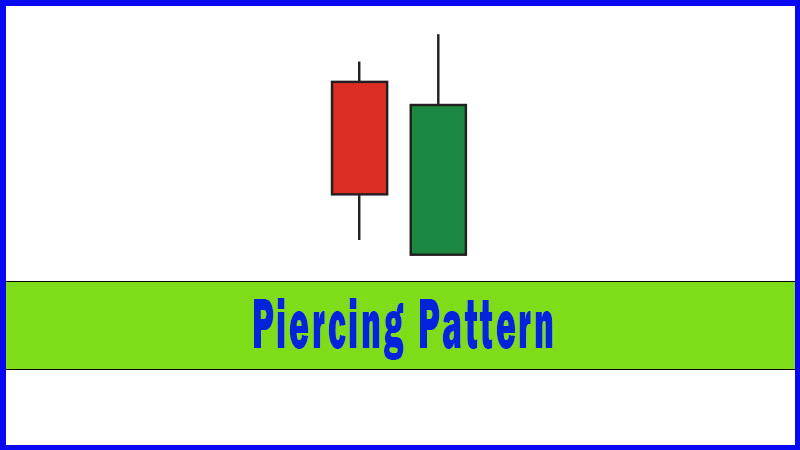
The importance of the Marabuzo line to most of these patterns
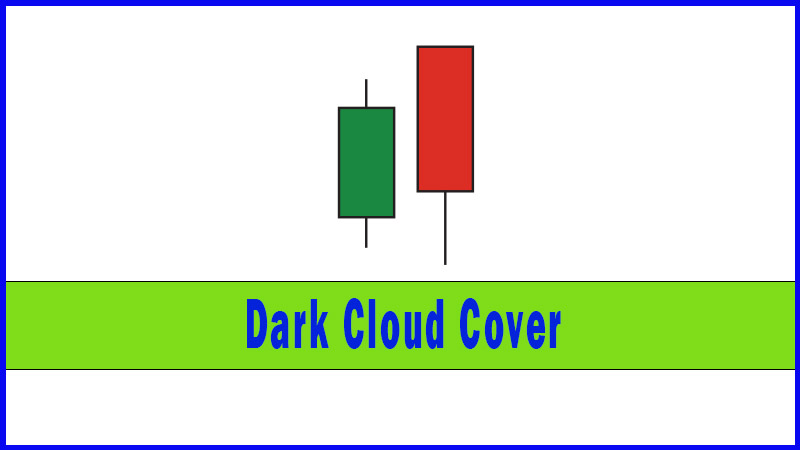
In
looking at the Dark Cloud Cover, Piercing Patterns, and Morning and Evening
Stars you have been introduced to the concept of the Marabuzo line, a level
that defines when prices are moving well into the real body of a preceding
candlestick. Prices need to break through this level to form these patterns,
and it needs to do so on a closing basis.
An
Evening Star isn’t an Evening Star if the third candlestick in the trio doesn’t
close below the Marabuzo line of the first. Similarly a Dark Cloud Cover
formation is only formed when weakness on the second session takes us below the
Marabuzo line of the green candle posted beforehand. Of course this weakness
also has to be maintained into the close, but the breaking of this level has to
occur first, and this very often sees these levels becoming a strong focus.
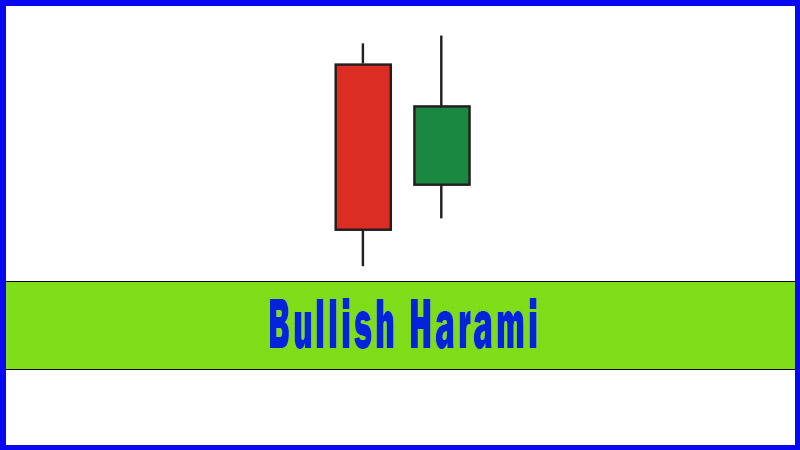
Marabuzo lines for reversal rejection and trend confirmation
Marabuzo
lines can also be excellent “lines in the sand” if you want to confirm a
reversal pattern, even if they’re not required in the set of rules. For
example, I said in the last chapter that Harami generally aren’t the strongest
of reversal patterns, and that a bit of extra confirmation is always good in
this situation. Have a look at the following chart:
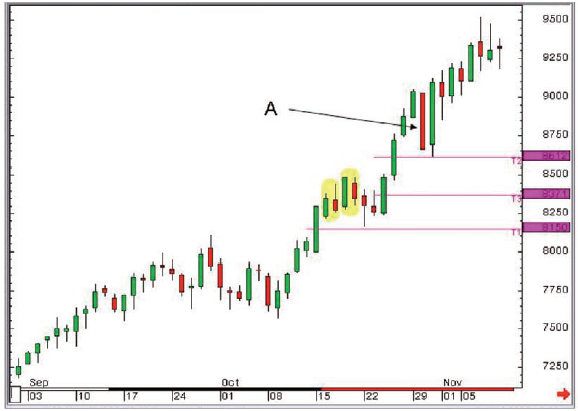
Figure 4-19: ICE Brent Crude Oil
futures (all sessions, unadjusted continuation); daily candlestick chart; 4
September 2007 - 6 November 2007
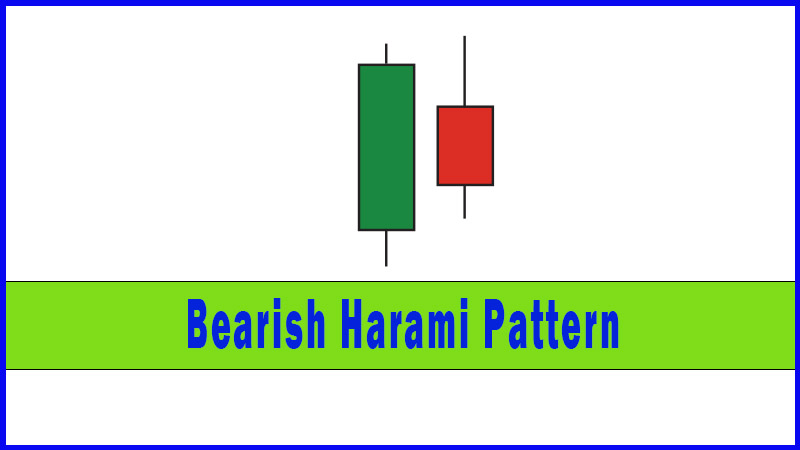
Two
Bearish Harami patterns were posted in a row on 16 and 17 October, then again on
18 and 19 October. Only a few days earlier, on 15 October, a big green candle
with a Marabuzo line at 81.50 was posted. Looking back at my commentary after
these Harami patterns, we see that the reversal patterns were flagged, but I
asked that the market take out 81.50 before becoming too concerned that a
change of trend was taking place.
The power
of the Marabuzo line came into play again a week or so later. You can see a big
red candle was posted at point A (30 October 2007). This was one of the most bearish
days the oil markets had ever seen in absolute terms (at the time), but I went
into the next day sticking with a bull stance, because the market hadn’t broken
86.12, the Marabuzo line from the big open candle posted on 25 October 2007.
In fact I
said on the very next day that if 86.12 held, one should be using the weakness
as a buying opportunity. Needless to say I was very pleased to see the low of
the day coming in at 86.13, followed by a very swift rally that swept away any
of the worries created by the previous session.
So I’m
happy to put a Marabuzo line on any large bodied candlestick because I’ve noted
over the years that these can be extremely good support or resistance levels
over the next day or two - or sometimes for even longer.
Just for the sake of clarity, below is
a good example of Marabuzo lines proving to be a good reference to stay with
the bears in a down move.
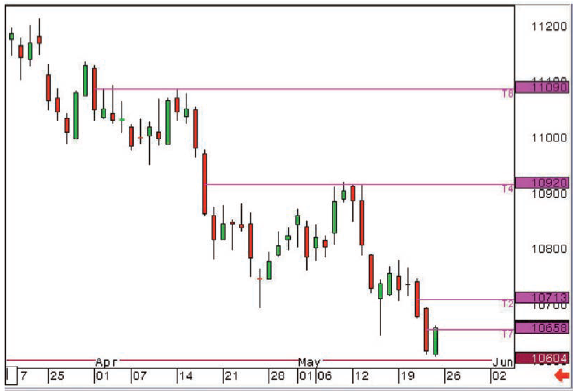
Figure 4-20: LIFFE Long Gilt futures
(adjusted continuation); daily candlestick chart; 17 March 2008 - 23 May 2008
One thing
worth noting at this point is that these lines generally work best if they give
support in an uptrend or resistance in a downtrend. Let’s go through all of
these conditions for clarification purposes.
If the
market is in a solid uptrend you will see many strong days with large green
candles. After these big up days we are generally left looking at a big green
real body to which we can apply a Marabuzo line. Any weakness in the subsequent
days often finds support at these lines. Think about it; in an uptrending
market you should be looking for buying opportunities, or support levels where
the buyers are likely to step back in. I always suggest looking to trade in the
direction of the underlying trend, for example buying dips to support in rising
markets. Unless you have extremely deep pockets it’s far better to try and
position yourself in line with this. It’s much easier to walk out of a train
terminal during the rush hour than into the station, because you’re going along
with the tide of the crowd, and not trying to push against it.
If you’re
in a downtrend and looking for selling opportunities you could do worse than
short the market at the Marabuzo line of a big red candle, as the example on
the previous page shows clearly.
Psychology of Marabuzo lines
What’s
the psychology that makes Marabuzo lines so effective? I think there may be
something about halfway that makes people sit up and pay attention. I’ve never
run a marathon but I know a few people that have, and they all said that the 13
mile mark is an important one: knowing you’re halfway round gives you a boost.
I feel like that most Wednesday lunchtimes!
Once
prices get back above the Marabuzo line of a big red candle in a downtrending
market, the bulls feel like they’ve achieved something. This is a rarity at the
time, of course! The bears who defended this level, and possibly used it as a
selling opportunity, have been wrong-footed and need to buy back to stop out.
There may have been bears who weren’t going to worry about their short
positions unless some key resistances started being retaken. The Marabuzo line
would be one such key resistance, so its break may cause these shorts to start
covering.
Marabuzo lines summary
To sum
up, I think Marabuzo lines can be a great tool for answering those big
questions that are posed after large directional days.
Debt
markets often see a strong reaction to the US Employment report on the first
Friday of every month. The Monday after can often be a day of head-scratching
as people try to decide whether the big move seen on the Friday should be
followed by more of the same, or whether it was just a bit of over-reaction
(“surely markets don’t over-react?” he asked sarcastically).
Marabuzo
lines can often answer this question. Say the market saw a strong reaction to
the numbers and rallied from an open at 116.00 to a close of 118.00 on the
Bonds. The Marabuzo line will be at 117.00. We can say that all the time the
market remains above 117.00 we can feel comfortable with the idea that the
gains can be sustained and that the market is heading higher. However, if
prices fall back through 117.00 maybe Friday’s gains were overcooked, and in
the cold light of day the sellers have been presented with an opportunity.
I have found over the years that these lines can
provide extremely powerful and reliable levels of support or resistance,
particularly in strongly trending markets.
Uses of Candlestick Charts : Chapter 4. Multiple Reversal Patterns : Tag: Candlestick Pattern Trading, Forex : morning star candlestick, morning star candle, morning star candlestick pattern, morning doji star, morning star candle pattern, morningstar pattern - Morning Star Pattern