Setups and Triggers
candlestick formations, pivot point analysis, candle patterns, price momentum, support and resistance level
Course: [ The Candlestick and Pivot Point Trading Triggers : Chapter 8. Setups and Triggers ]
There are many methods you can employ to actively trade, including various mechanical trading systems and manual trading tactics.
Combining Candles and Pivots
There are
many methods you can employ to actively trade, including various mechanical
trading systems and manual trading tactics. The constant changing of market
conditions can require system traders to adapt and update the parameters for
their trading decisions. I often prefer the hands-on visual approach, which is
more of a manual method, while employing a mechanical trigger to both enter and
exit a position with a specific risk management technique. The visual approach
is aided by the use of candle charts.
The
triggers discussed in this chapter are based on the methodology developed from
my 26 years as a trader. I have continually strived to find clearer signals and
triggers for short- and even longer-term trade opportunities. I have been doing
extensive research regarding the combination of candlestick formations and
pivot points; some of the proprietary signals that I have taught traders at
seminars and in my course, I am sharing in this book. This chapter details the
triggers designed by me, based on my research joining both specific candle
patterns and pivot point analysis.
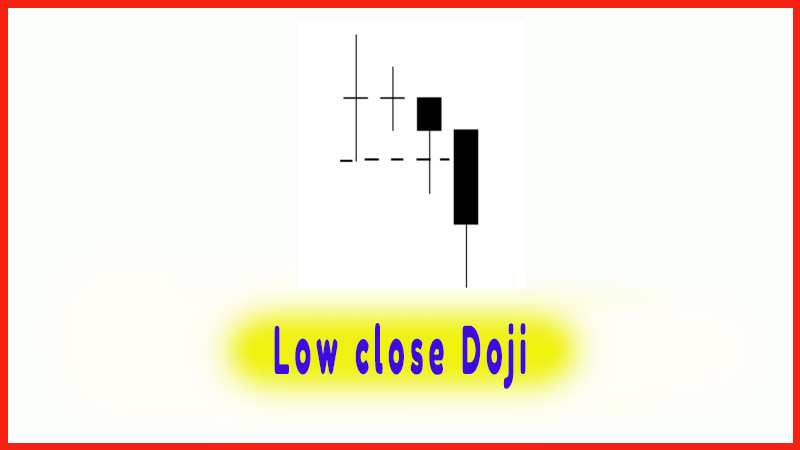
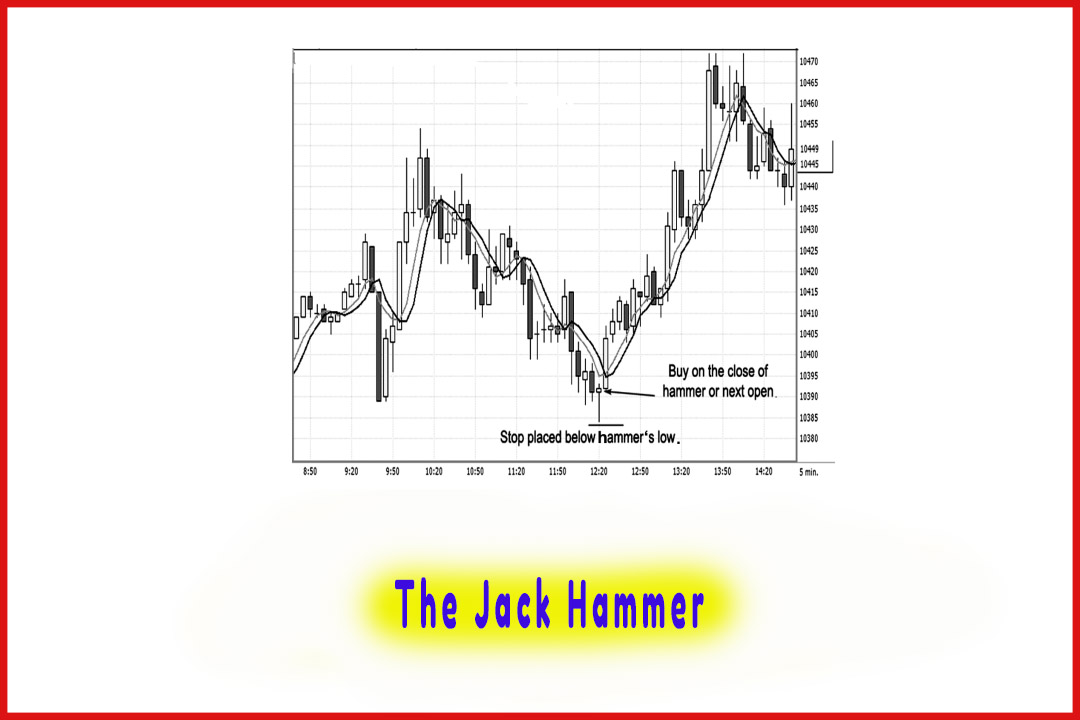
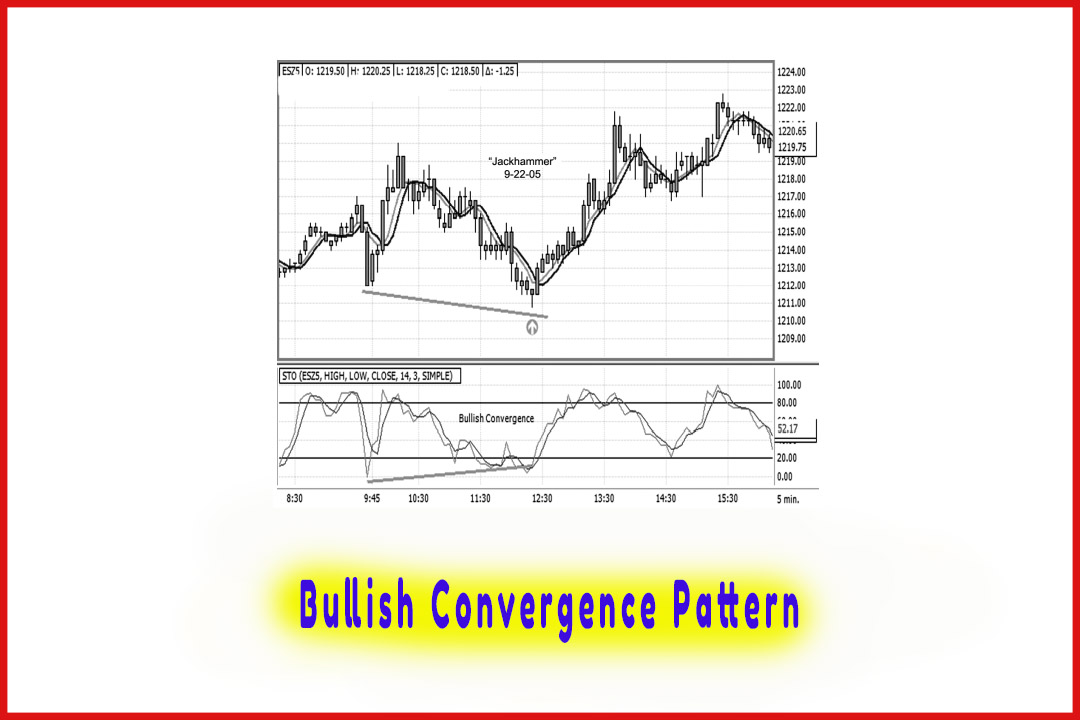
I am
going to cover three setups: (1) the high close doji (HCD), (2) the low close
doji (LCD), and (3) the jackhammer. Each one has a special set of rules by
which to initiate a trade and to exit a trade. These strategies have done well
in periods of both bullishness and bearishness, as well as in times of
heightened volatility and periods of low volatility.
This is
just a small sample of what is taught in my three-month intensive trading
school. I have been asked why I would share such high- probability trading
signals with the public. Well, I have taught these methods to many people,
including my own father and son. Just as they have different results with the
same signals, you will, too, due to the very nature of trading. Once my trading
concepts are taught by the masses, I do not believe the signals will be diluted
or absorbed in the marketplace.
I believe
not every trader will implement my methods in exactly the same way as I do. For
example, Larry Williams has his OOPS method, Mark Fishers has his method, and
Tom Demark had his method let out to the public. And all these systems, to my
knowledge, are still highly effective strategies. So I do not believe letting
you into my “black box” will hurt or dilute the signals.
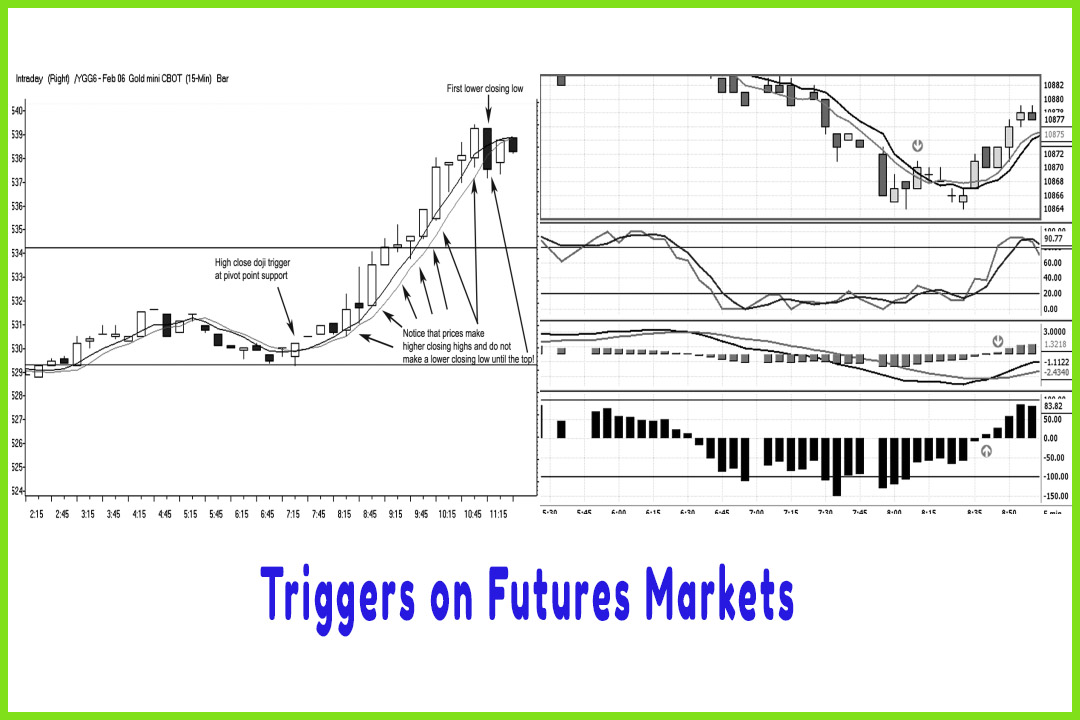
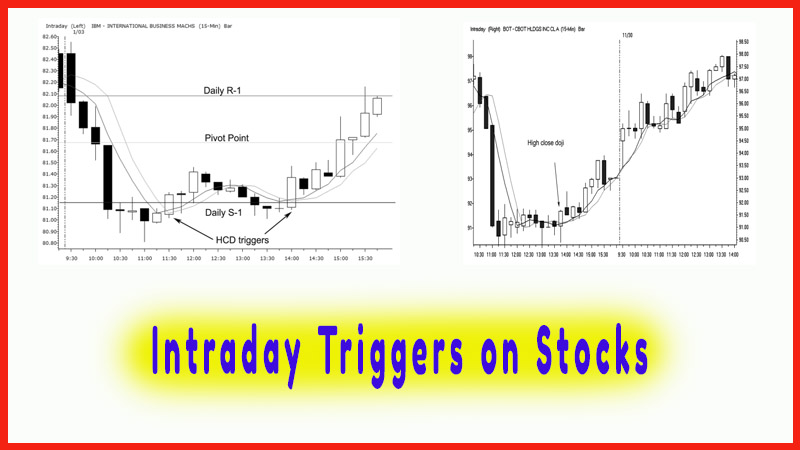
There are
various markets and various time periods in which to enter a trade, such as a
60-minute, a 15-minute, and a 5-minute time period for swing and day traders.
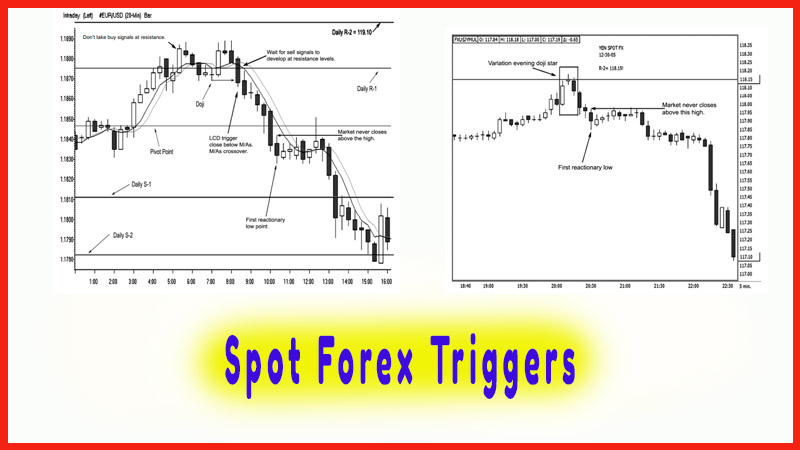
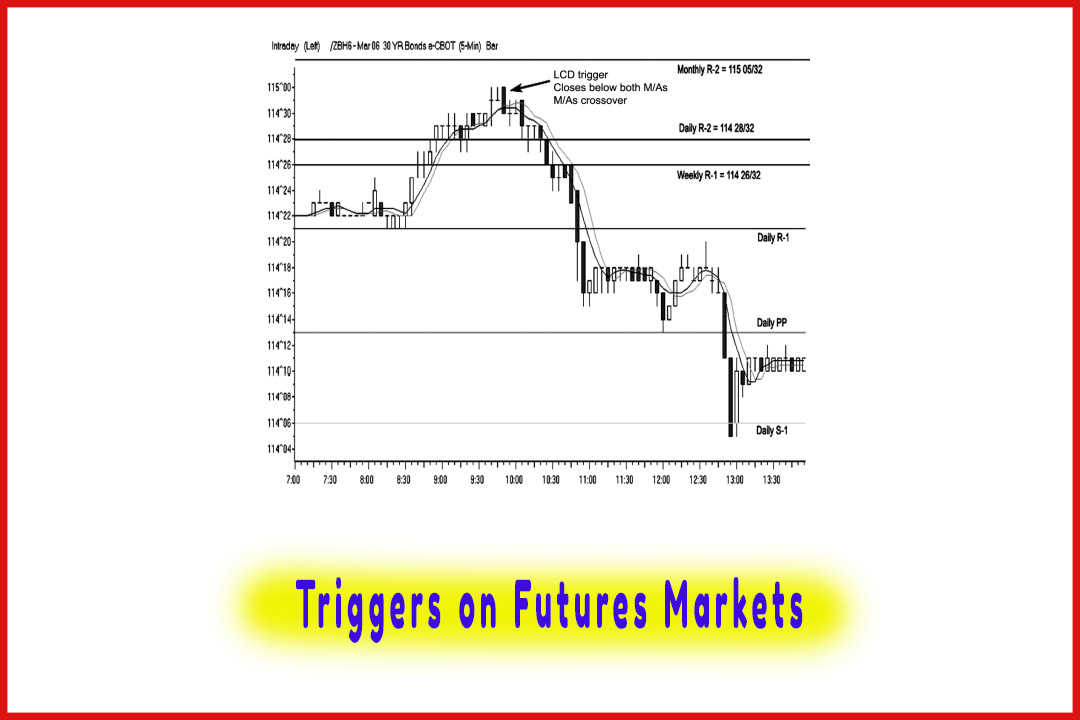
These signals work for futures and stocks, and they work amazingly well in the
foreign exchange (forex) markets, as you will see in the coming examples. The
premise is to help keep the trader focused on the now, to watch and study the
current price action. The candle patterns give a visual confirmation of price
momentum, and the pivot points forewarn you of what the potential turning
points are. When you combine the two methods, you have a solid trading program.
This setup may help you improve your trading performance and allow you to
develop a consistently winning trading strategy. This could be your personal
trading system that is based off proven and powerful techniques. For a moment,
I want you to envision the concept of epoxy glue: It requires two compounds.
Separately, they are not very reliable or, in fact, a very strong bonding
substance. However, when combined, a chemical reaction occurs and forms an
amazingly strong and powerful bond. Using the methods of candlesticks with
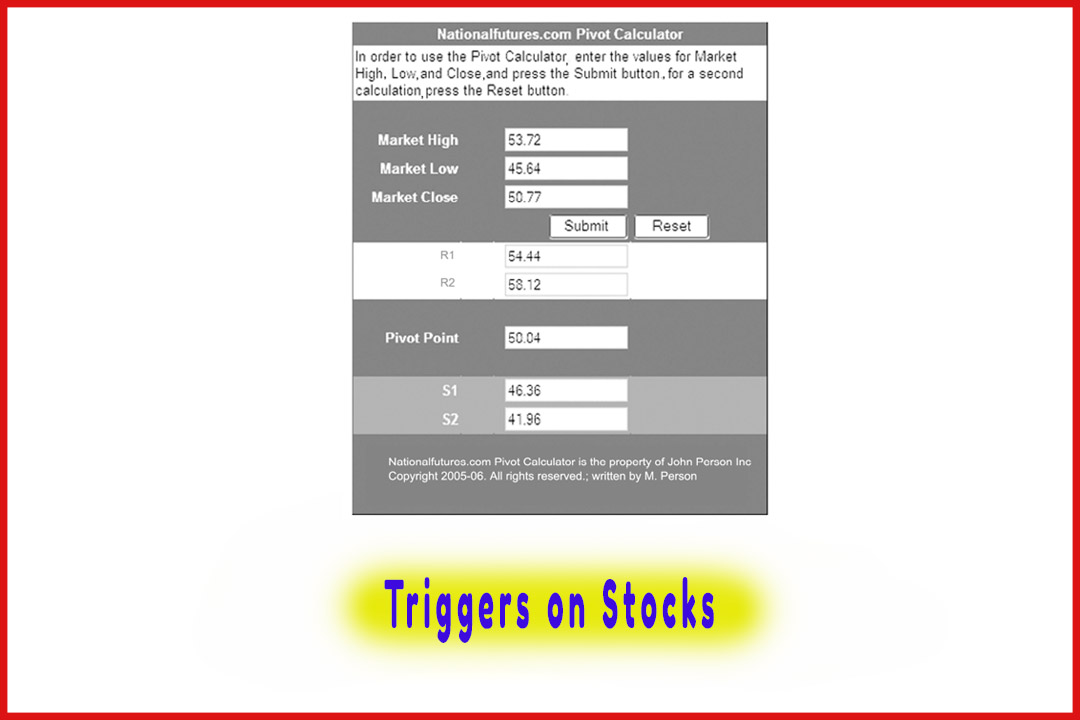
pivot points can give you that same result if you know what to look for. The
implementation of longer-term analysis using pivot points will give a trader a
fantastic means by which to anticipate a point where a trend change could
occur, thus helping a trader not only to prepare but also to act on a trade
opportunity. One can implement this setup using different time frames besides
daily analysis. You can include weekly and even monthly pivot point
calculations. This method of analysis will alert you well in advance of a
potential support and/or resistance level. In the setup process, you will
heighten your awareness to enter in a long or a short position against
predefined levels and will wait for the trigger or market signal at those
levels. It can not only help you define or identify the target area to enter
but also establish your risk objective. Another event that occurs with this
setup process is that you now can set up your orders to buy on your trading
platform with the selected contract amounts—in other words, pre-arrange the
commands on the electronic order ticket. Now all you need is confirmation so
you can pull the trigger or click the mouse to establish an entry in the market
and establish a position.
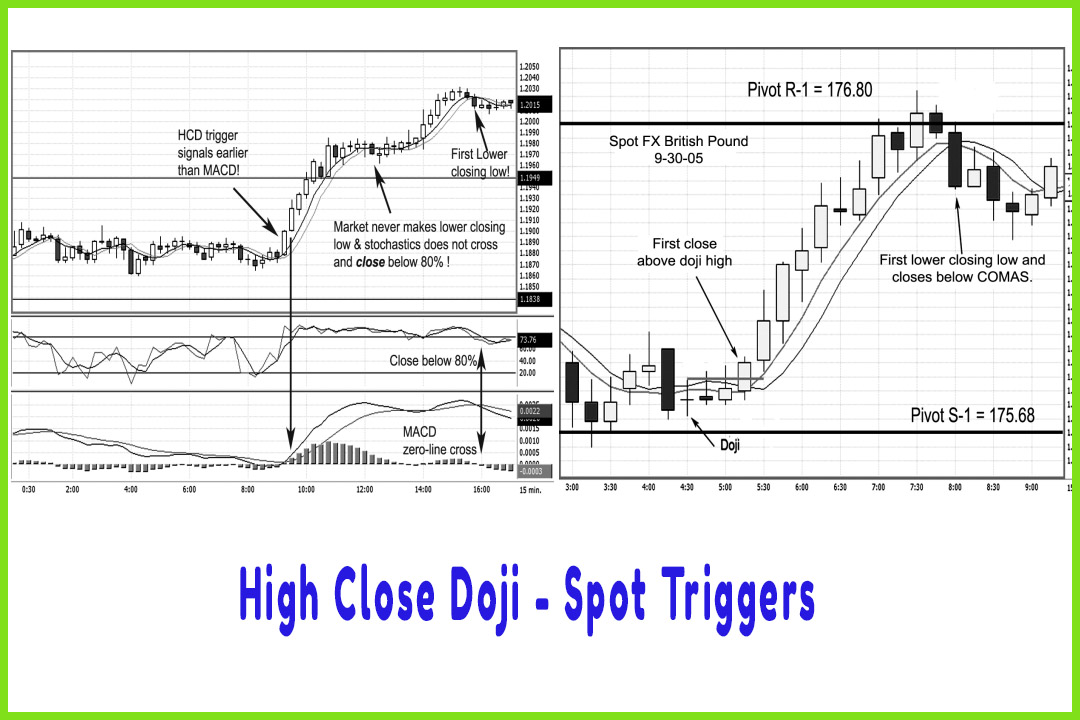
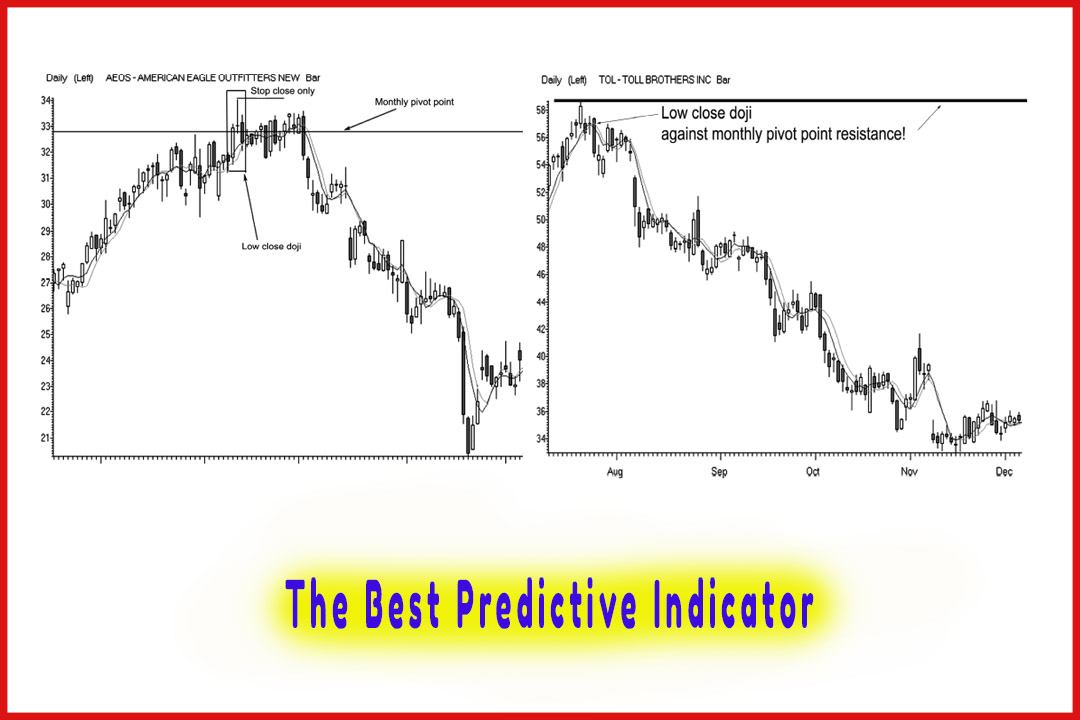
In
Chapter 7, we covered the importance of dojis and the statistical relevance of
why I look for them at pivot point support targets. The primary importance in
the study of the doji at a pivot is to understand that the doji indicates
indecision and is a significant sign that changes are coming. In candle
patterns, the morning doji star is one of the most reliable reversal formations
that a trader can identify.
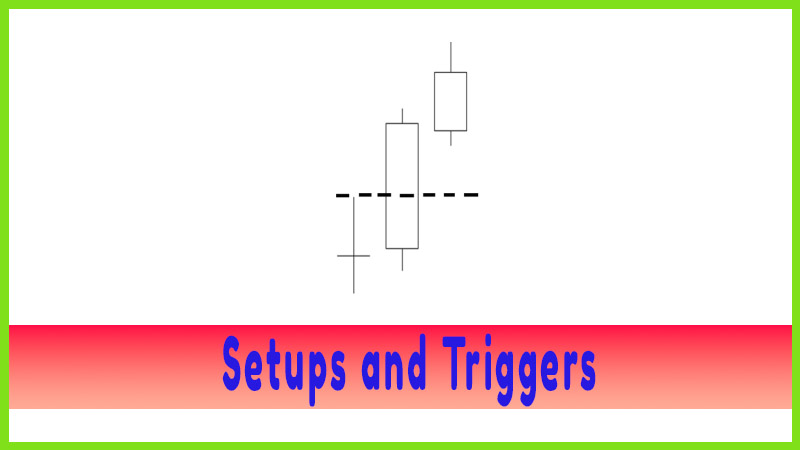
The
problem is that there are about 12 variations, making it hard to write code to
program in a trading software package. However, the main component about the
doji is the trigger indicating when the next time period’s close is higher than
the doji’s high. This can be a subtle change by just two PIPs in forex or ticks
in futures. It cannot be at the exact high of the doji; rather, it needs to
close above the doji high. This is a very important point, so make sure you are
crystal clear on it. Figure 8.1 demonstrates the definition of a close above
the doji high.
The Candlestick and Pivot Point Trading Triggers : Chapter 8. Setups and Triggers : Tag: Candlestick Pattern Trading, Forex, Pivot Point : candlestick formations, pivot point analysis, candle patterns, price momentum, support and resistance level - Setups and Triggers