Volume Helps Find Strength of the Trend
volume indicator strategy, volume indicator in share market, volume indicator in stock market, volume indicator mt4
Course: [ The Candlestick and Pivot Point Trading Triggers : Chapter 4. Momentum Changes ]
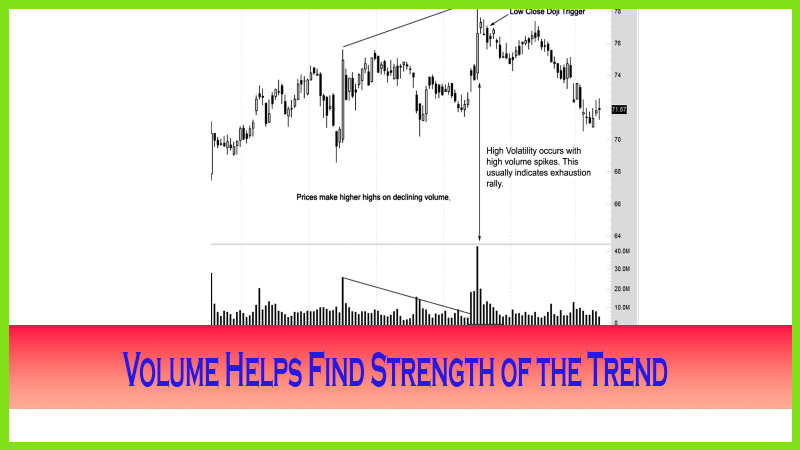
Volume helps the position trader identify the strength of the trend of the lack of conviction of market participants.
INTEGRATE VOLUME AND INDICATORS
Volume
helps the position trader identify the strength of the trend of the lack of
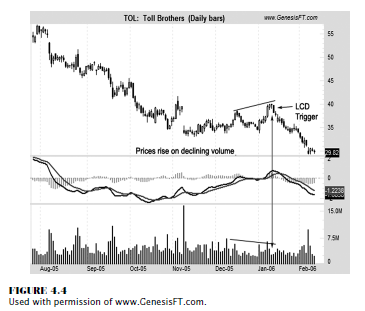
conviction of market participants. Take a look at Toll Brothers in Figure 4.4.
This stock took a complete nosedive starting in mid-July. Many thought that the
bottom was in and that a rally would take this home builder back to the highs.
Not quite so, said the volume! There was a rally attempt, but it was on lower
volume. Adding the MACD indicator shows confirmation that a price trend or
market rally would not occur. The MACD signaled a negative zero-line cross, and
the moving average components crossed as well. The low close doji trigger did
not help matters for hopeful bulls either. As the failed rally crumbled, the
downtrend resumed and volume started to increase, confirming a bear trend. The
MACD indicator continued to back that downtrend, warning traders that lower
prices would prevail.
I want to
illustrate how you can integrate volume with both MACD and stochastics so you
can see how helpful volume analysis can be to indicate overbought market
conditions.
Armed
with this information, you will have an easier job identifying trading
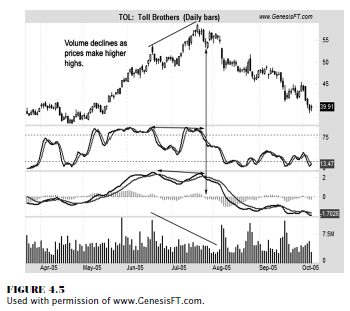
opportunities and a less stressful time choosing a strategy. Figure 4.5 shows
Toll Brothers at its peak. It was a media darling. The housing bubble was ready
to burst; so when people say they never saw it coming, they just did not know
what to look for. The market went into a blow-off phase, which resembles the
pattern or condition that Apple Computer was in in Figure 4.2. The volume was
declining on higher prices, the MACD had a lower high, and stochastics
confirmed the bearish divergence. A low close doji pattern formed at the top
(which was within pennies of the monthly pivot resistance number). Once the
price reversal occurred, you can see how much volume picked up, confirming the
trend reversal. In fact, the average daily volume levels increased as the
downtrend materialized.
BULLS TAKE CHARGE
I
illustrated the relevance of volume confirming technical indicators and stated
the principles that apply to all actively traded markets, including forex or
spot currency traders. The opposite signals work for identifying bottoms in all
actively traded markets. Let’s look at one of my favorite stocks, Starbucks.
What an experience! Paying two bucks for a cup of black joe! I’ll tell you
what, if it hadn’t been for my friend Les Zieba (my coffee connection) and
Starbucks, this book would most likely never have been finished. Just on my
intake of Ventes alone writing this book, I probably added a dollar per share
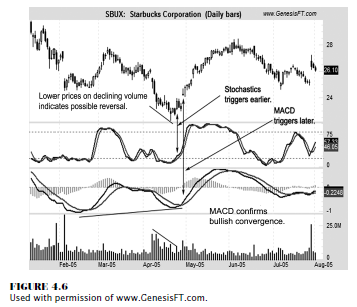
to the value of this stock. In any event, let’s look at the chart in Figure
4.6. The stochastics and, more important, the MACD displayed a solid bullish
convergence, with corresponding higher lows as prices made lower lows. As the
price dipped, forming a hammer, notice how the volume levels declined. As we
discussed in Chapter 3, the MACD can trigger a signal later than stochastics
can, and here we see that occur. The point is, the volume levels were declining
on newer lows, indicating that this market was percolating—ready to reverse
higher, full steam ahead!
TRADERS NEED TO ASK MORE QUESTIONS
I always
like to ask myself questions about a market or a potential trading opportunity.
One such question is, If a market is so bearish, why does it not go down?
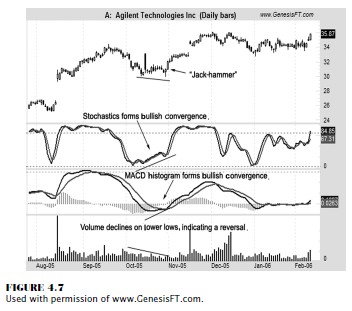
Figure 4.7 shows Agilent Technologies, a solid company that was one of the many
tech darlings that imploded. As we see, the market appears ready to decline and
fill the gaping hole called a gap between 26 and 28 in August 2005. Notice that
the chart pattern makes a lower low formed by a hammer candle. But the market
decline was on significantly lower volume. On one hand, one would think the gap
would be “filled” as prices trade back near the low end of where the gap was
created near 26 per share. But on the other hand, volume and both the MACD and
stochastics indicators worked together to indicate otherwise. Prices reversed
sharply higher based off the jackhammer pattern (we discuss this very bullish
pattern and the rules to trade it in Chapter 8). As the price of this stock
traded higher, notice the volume levels moved in the price direction, meaning
volume was increasing on increasing prices.
You can
identify overbought or oversold conditions based on a variety of methods.
Volume studies help me understand what the true strength or weakness of a trend
is.
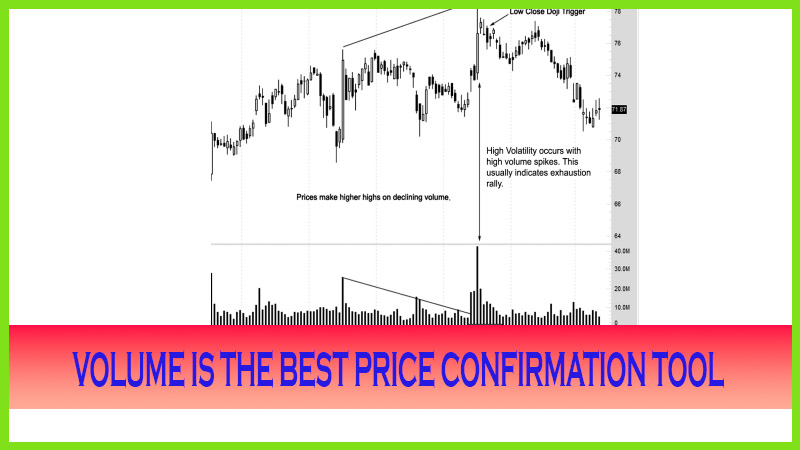
When
prices are making what can be perceived as a “false high,” meaning a higher
high, it is accompanied on lower volume levels. When volume levels are not
moving parallel with prices, a divergence is occurring. So if prices are moving
up, we should see volume moving up. When price is going up and volume is going
down, something is wrong and I need to ask myself why. It is at this point that
I am aware that something is not internally correct with the market, especially
if the fundamentals are wildly bullish. If volume is not confirming the price
action, I should take that clue and should start looking for strategies in
which to capture a potential trend reversal opportunity, whether it is by
liquidating a long or by initiating a short position or by buying a put option
or by taking on another option strategy.
The same
holds true for the opposite condition: When prices are making a false bottom,
we have a bullish convergence or oversold condition. That situation exists and
can be spotted as the price direction is not confirmed by volume. If prices are
making lower lows, if the market is truly bearish, we should see heavy volume.
When volume levels are light and prices are declining, it is a signal that
selling pressure is drying up. Then as prices reverse higher to confirm a true
turnaround, we should see volume increase as buyers come into the market. This
is exactly what happens in Figure 4.7. In addition, using the indicators to
help spot these false bottoms will give you added confidence not only to
execute a trade but also, more important, when.
The Candlestick and Pivot Point Trading Triggers : Chapter 4. Momentum Changes : Tag: Candlestick Pattern Trading, Forex, Pivot Point : volume indicator strategy, volume indicator in share market, volume indicator in stock market, volume indicator mt4 - Volume Helps Find Strength of the Trend