VOLUME PRICE CONFIRMATION TOOL AND TREND INDICATOR
Price momentum indicator, Trend finder indicator, confirm market price extremes
Course: [ The Candlestick and Pivot Point Trading Triggers : Chapter 4. Momentum Changes ]
The principles are the same and apply to all three markets. Remember that a good trader has a reason for entering a trade.
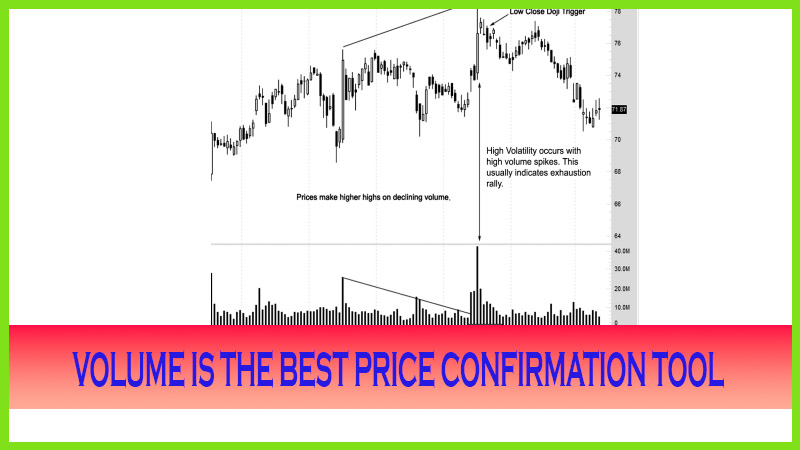
VOLUME IS THE BEST PRICE CONFIRMATION TOOL AND TREND INDICATOR
In
Chapter 1, we went over the basic rule structure for volume analysis. But how
can we apply that to help confirm market price extremes? This is actually
fairly simple, if you know what to look for. That is what this section is
designed for. It does not matter what market you are trading, whether it be
stocks, futures, or forex. The principles are the same and apply to all three
markets. Remember that a good trader has a reason for entering a trade. A great
trader waits until the signal triggers and then acts on that signal. Just
because a market goes up and is “too high” in value does not mean it is going
down, at least not until the signals are present. Market price extremes are
generally a reflection of high volatility; and with high volatility comes
increased market participation or action, and that action is measured or
reflected by high volume.
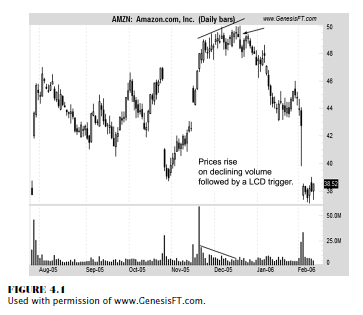
OVERBOUGHT MARKET CONDITION— A DEAD GIVEAWAY
If you drop a boulder off a cliff, it falls at a speed that
is much greater than the speed of the boulder being pushed up a hill. That is
the analogy of what happens when a bull market or uptrend stretches too far too
fast, or is “overbought.” So we look for these types of conditions in which to
ride the price direction if we are looking to establish a short position or we
want to exit a long position before the boulder falls. Using volume analysis in
con-junction with indicators is a powerful tool to help you determine whether a
market price trend may continue. Look at Figure 4.1. This chart on Amazon is
a dead giveaway that the price appreciation was unsustainable; as we see, the
market moved from a bullish trend to a consolidation phase with higher highs.
However
the volume levels were declining, giving a direct clue that the price advance
was unsustainable. When combined with the low close doji pattern, which we will
disclose in Chapter 8, and a shooting star, there was no reason to stay long
this market. Notice that as prices started to depreciate, the volume increased,
which reflected sellers’ active participation, which attracted more selling.
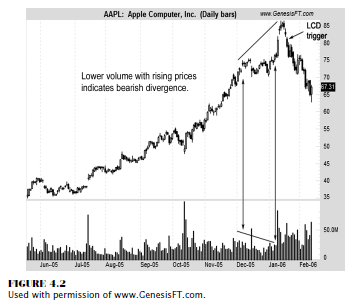
THE “COMEBACK” KID STOCK
In
Figure 4.2, we see one of the greatest success stories in 2005 for any company,
Apple Computer. It just could do no wrong, except when the price of the stock
advanced too far too fast, culminating in an overbought unsustainable price extreme.
The fundamentals were quite rosy, as
holiday sales were through the roof on iPods and accessories. You want to talk
about a racket; this company has products on top of products that accessorize
the accessories, none of which are inexpensive. What a gold mine! Holiday sales
were strong, and the market blasted off. In fact, notice the gap up, then
notice the gap down, leaving what we technicians call an island top. (This
formation is covered in Technical Trading Tactics on page 75.) It also formed
the low close doji pattern. It really is the volume that helped confirm the
market’s overbought condition. As prices broke out of the sideways pattern,
from a high near 75 as it went onward to over 85, see the volume decline
showing fewer market participants wanting to join the price advance. As the
sell-off materialized, like a boulder falling off a cliff, more participants
started selling as volume increased, signaling a strong price reversal.
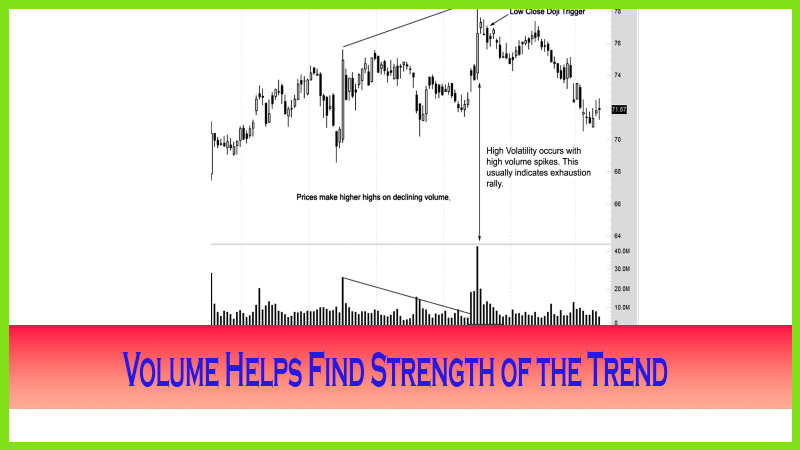
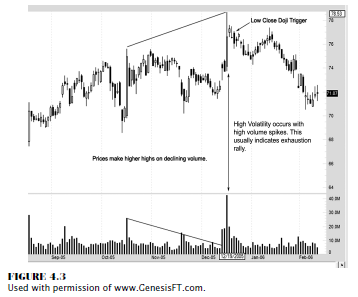
BLOW-OFF TOPS ON VOLUME SPIKES
Volume
levels help confirm the true strength of a price move if the market
demonstrates a price increase. If volume does not confirm the market’s new
assigned value, something is wrong and a price reversal is imminent. Volume is
also a great indicator of blow-off tops, or what is called an exhaustion rally.
Volume spikes or surges can and do indicate price reversals, especially after a
price advance on declining volume is preceded by a lack of price
follow-through. As we study the chart in Figure 4.3, you see that the huge
price advance is accompanied with abnormal or heavier than usual volume. You
would anticipate that a breakout to sharply higher levels would occur. The high
volatility reflects the increased volume levels; and as the next time frame
shows, there is no follow-through to back the price advance. This is a clear
sign of a price reversal. The low close doji trigger also seals the deal that
this was simply a one-day wonder rally that failed, and a price reversal was to
be expected.
The Candlestick and Pivot Point Trading Triggers : Chapter 4. Momentum Changes : Tag: Candlestick Pattern Trading, Forex, Pivot Point : Price momentum indicator, Trend finder indicator, confirm market price extremes - VOLUME PRICE CONFIRMATION TOOL AND TREND INDICATOR