Fibonacci Retracements are based on a Trendline
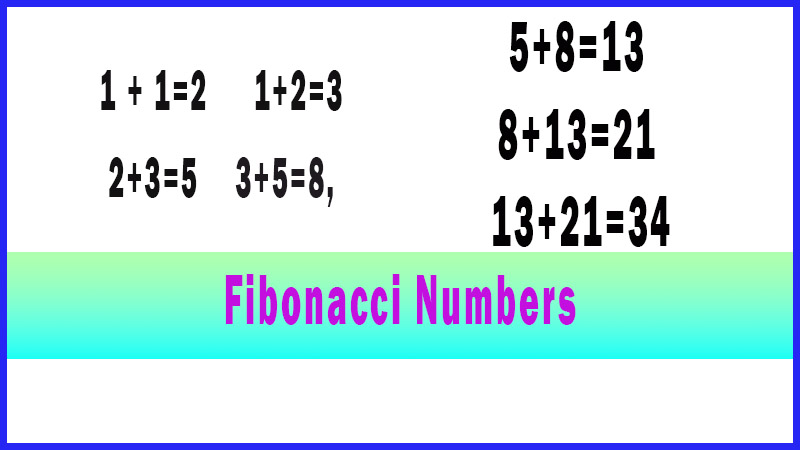
Fibonacci Numbers, Fibo trading, Fibonacci Retracements, Fibonacci trading course
Course: [ How To make High Profit In Candlestick Patterns : Chapter 4. Candlesticks with Technical Patterns ]
If the 38%, 50%, and 62% area are known to be retracement levels that many technical investors are watching, then it makes sense to analyze what candlestick signals might be occurring at any one of those levels. The advantage of being able to read the candlestick formations is very beneficial.
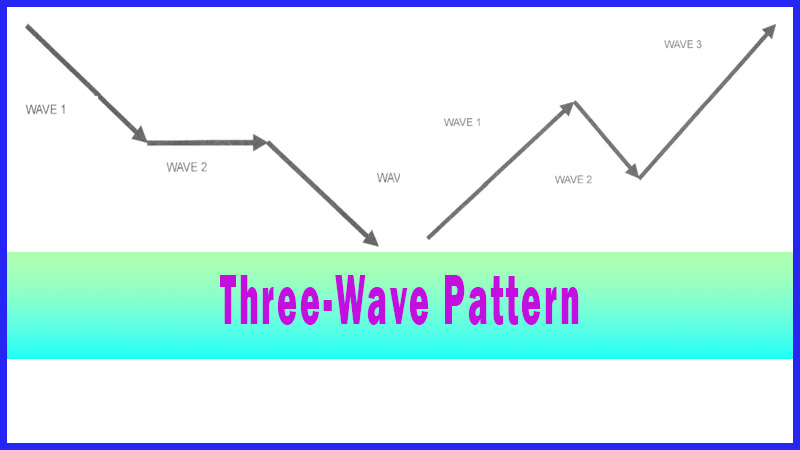
Fibonacci Retracements are based on a Trendline
1. Fibonacci
Retracements are based on a trendline drawn between a sustained trough and
peak.
2. If
a trend is rising, the retracement lines will descend from 100% to 0%
3. If
a trend is declining falling, the retracement lines will move up from 0% to
100%
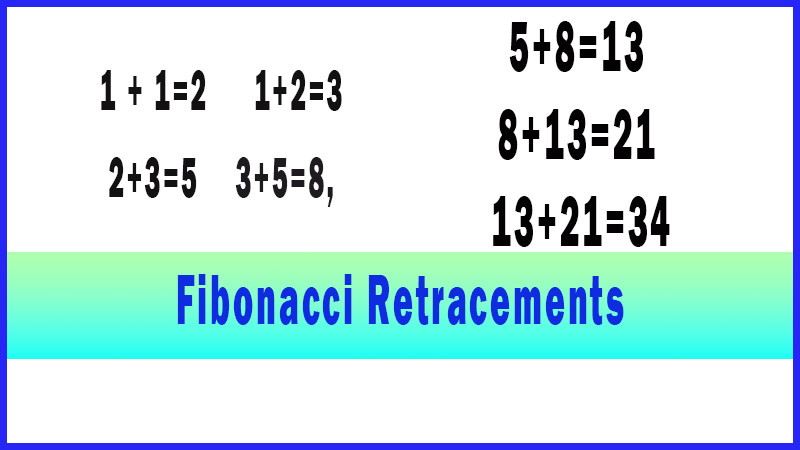
4. Horizontal
lines can be drawn at the common Fibonacci levels of 38%, 50%, & 62%
5. As
the price retraces, support and resistance occur at or near the Fibonacci
Retracement levels with a high degree of accuracy.
If
the 38%, 50%, and 62% area are known to be retracement levels that many
technical investors are watching, then it makes sense to analyze what candlestick
signals might be occurring at any one of those levels. The advantage of being
able to read the candlestick formations is very beneficial. It allows an
investor to evaluate immediately which one of these levels is going to act as
support or resistance. That knowledge allows the candlestick investor to position
themselves ahead of other technical analysts that need confirmation that a
specific level has held. For the daytrader, utilizing this knowledge can be
highly profitable when trading the index futures. Being able to enter a trade
at the exact optimal level provides a very high-profit, low-risk trading
platform. Utilizing the Fibonacci number levels can be used as a primary trade
entry system or it can be added as an additional entry parameter. Where will a
pullback stop? If a trend pattern can be recognized, then watching for the
candlestick signals at support levels that other investors are watching can
prepare the investor for when a reversal should occur.
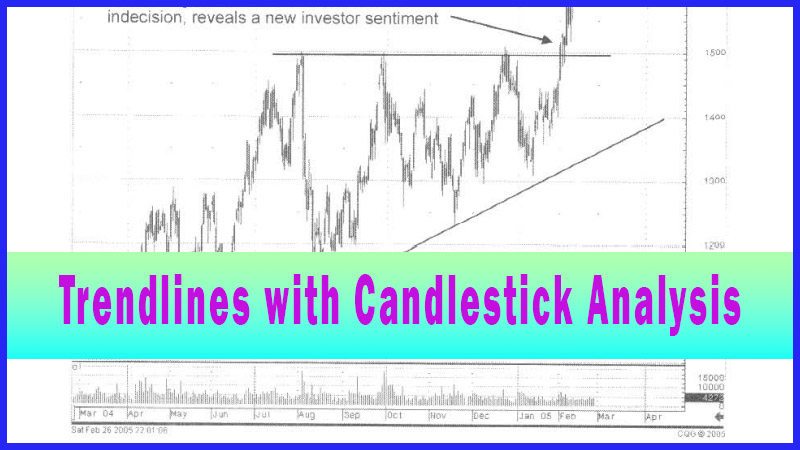
As
seen in Fig. 18, the PLX Technology chart, a strong uptrend was followed by a
pullback. To identify where that pullback should stop, applying the obvious
technical indicators increases the probabilities of being in a correct trade.
The PLX technology chart illustrates the effective use of candlestick signals
with the Fibonnacci numbers. After an extended uptrend, a pull back occurs.
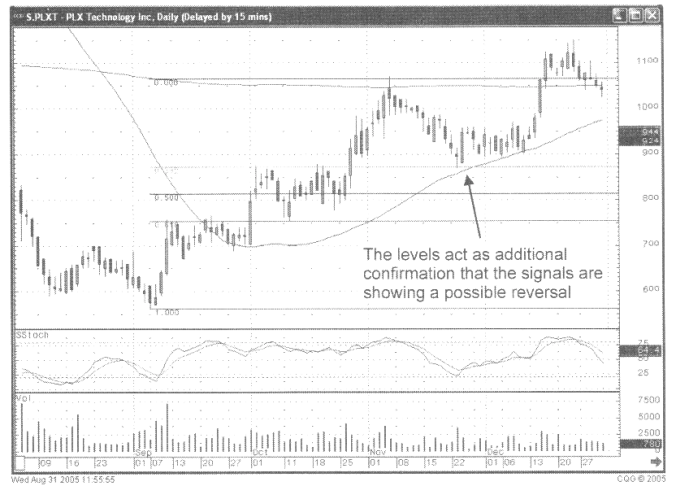
Fig.
18, the PLX Technology chart
Where
can a pull back be expected to stop? The moving average becomes a possibility.
Putting Fibonacci numbers on the chart becomes a logical target.
Witnessing
a Doji just barely touching the 38% retracement level becomes the point to
start watching for a reversal. A Doji, followed by a Bullish Engulfing signal,
reveals that buying started right at an important technical level.
Is
the 38% Fibonacci retracement level a place to watch for a reversal? Not
necessarily! The candlestick reversal signals are the primary decision making
factors. Placing the Fibonacci retracement levels on the candlestick chart adds
another element for indicating that a reversal has occurred.
Increase Your Probabilities
Utilizing
the candlestick signals in conjunction with any other technical indicator
increases the probabilities of being in a correct trade. The simple and obvious
technical indicators are the most productive. When the least experienced
investor can identify important levels on a chart, it has to be obvious to
everybody. Knowing that a candlestick reversal signal demonstrates immediate
information on investor sentiment, a candlestick investor is provided with a
very efficient analytical tool. A major candlestick reversal signal, occurring
right where everybody is watching for a reversal, allows an investor to take
immediate advantage of a trend change. Observe the obvious.
How To make High Profit In Candlestick Patterns : Chapter 4. Candlesticks with Technical Patterns : Tag: Candlestick Pattern Trading, Forex : Fibonacci Numbers, Fibo trading, Fibonacci Retracements, Fibonacci trading course - Fibonacci Retracements are based on a Trendline