Three-Wave Pattern
Best trading pattern, Top 3 trading Pattern, Top trading pattern, Best candlestick pattern
Course: [ How To make High Profit In Candlestick Patterns : Chapter 4. Candlesticks with Technical Patterns ]
Prices move in patterns. This is a function of the multitude of investment criteria of the investment community. An investor places money into a position, based upon their individual investment goals.
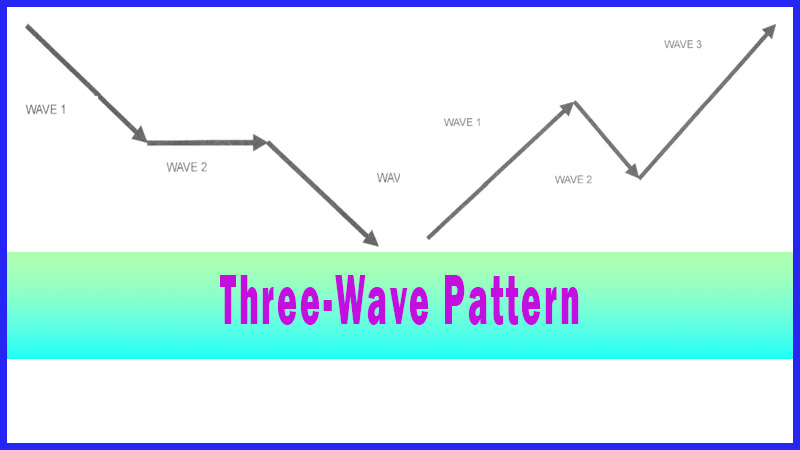
The Three-Wave Pattern
Prices move in patterns.
This is a function of the multitude of investment criteria of the investment
community. An investor places money into a position, based upon their
individual investment goals. Whereas one investor may be buying for the
long-term, the next investor may be in the position for a short-term trade.
Whatever the reasoning for an investor to commit funds to a trade, the price
movement of any trading entity will be predicated upon the emotional sentiment
of how that price movement reacts. Simply stated, the magnitude in which a
price moves will create changes in investor sentiment.
A
price that moves up too fast for normal expectations will cause profit taking
to occur. A price that moves in a slower consistent fashion will have a
different result in investor sentiment, causing a different pattern. The fact
that prices move in patterns/waves is evident in the existence of technical
analysis. Stochastics, Fibonacci numbers, Elliot Wave theory, trendlines and a
host of other technical methods have been developed as a result of prices
moving in predictable fashions.
The
most predominant study of wave patterns comes from the Elliott Wave theory.
Over 50 years ago, R.N. Elliott observed that price movements move in a series
of dramatic patterns. He analyzed that these patterns were based upon the
natural progression of the sentiment shift in mass investor psychology These
patterns or WAVES illustrated the oscillations between investor fear and greed.
Elliott
observed various types of wave patterns. His research formulated two basic
types of wave patterns. The impulse waves, waves which moved in the direction
of the predominant trend of the market consisted of five smaller ways. The
corrective waves, waves that moved counter to the main trend consisted of
three smaller waves. Unfortunately, these two wave patterns are just the basic
wave counts. The major difficulty of Elliot wave analysis is analyzing and
correctly labeling which wave count is currently occurring. It is always
difficult to define which wave count is in progress. Wave patterns can occur
inside other wave patterns.
The
wave patterns in the Elliot Wave analysis can also have variations to the basic
wave patterns, having seven or nine wave counts. Even R.N. Elliott admitted
that with the numerous variations of wave counts that could be applied to a
trend, each trend could be analyzed differently, depending upon the initial
wave analysis. He admitted that the interpretation of the wave counts could not
always have a stringently defined set of rules.
Apparently
there are students of the Elliot Wave analysis that have been able to convert
their knowledge of how the waves perform. They can produce very good profits
for their trading programs. The one consistent factor that successful Elliot
wave analysts reveal is that to become successful at analyzing the waves
profitably takes many years of experience. This is all well and good for those
that want to spend many years in learning how to invest successfully.
For
those investors that want investment methods that can be learned and used
effectively in a much shorter period of time, there are aspects of waves that
are much easier to utilize. Using candlestick signals in a three-wave pattern
becomes much more productive. A three-wave pattern can be defined as any wave
pattern that starts from a point where a new wave or trend becomes apparent.
This approach makes the wave pattern a projection element versus an
anticipatory element.
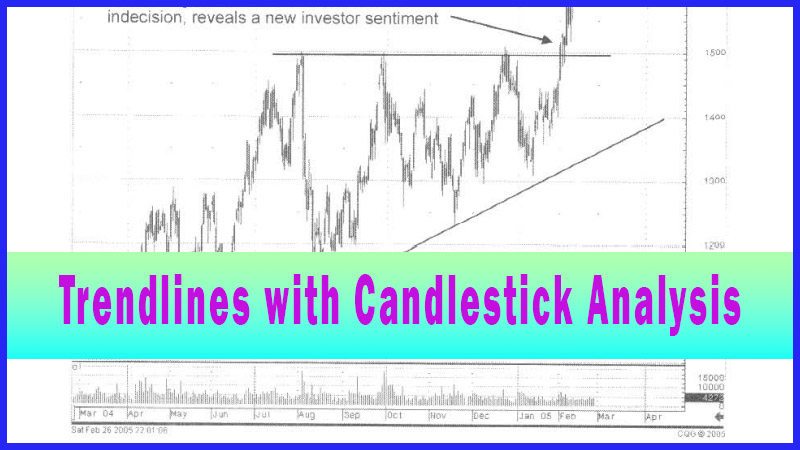
The
candlestick signals remained the main analytical tool for identifying a trend
reversal. The three-way pattern becomes a projection tool for how that new
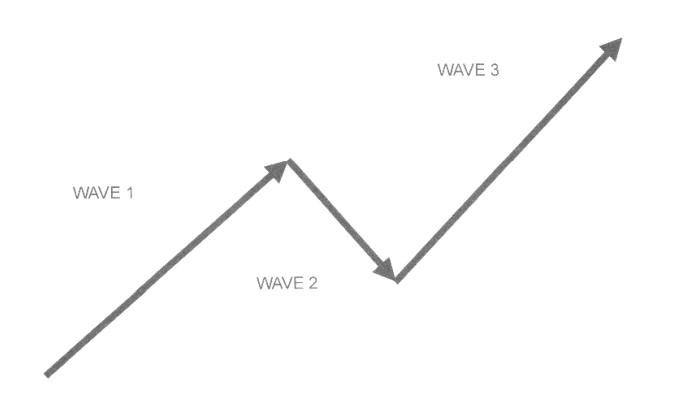
trend may perform. A three-wave pattern has a few different identifiable moves.
As illustrated in Fig.5-1, a trend can move up and then pullback. The third leg
of the trend now moves back up to test or exceed the previous high.
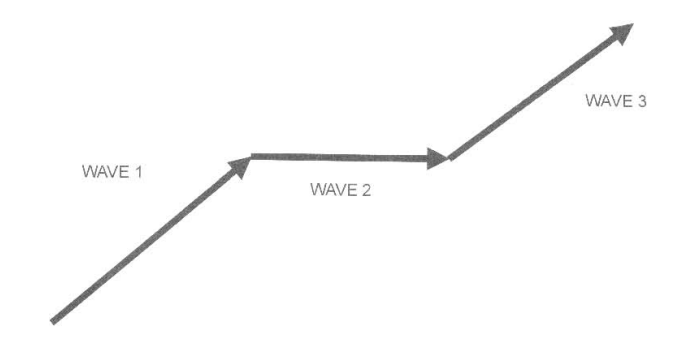
A
trend can also move up, with the following leg 2 moving sideways until leg
three begins the final leg of the pattern as seen in Fig. 5-2. This sideways
movement, once observed, can have some timing elements built into it. That
timing can be a result of the stochastics retracing to the oversold area and
curling back up. Then a candlestick ‘buy’ signal appears at the end of a flat
trading period. The end of the flat trading can also be correlated to the intersecting
of a major moving average. Most importantly being able to visually identify the
three-wave pattern set-up allows the candlestick investor to exploit the proper
timing of getting back into a trade.
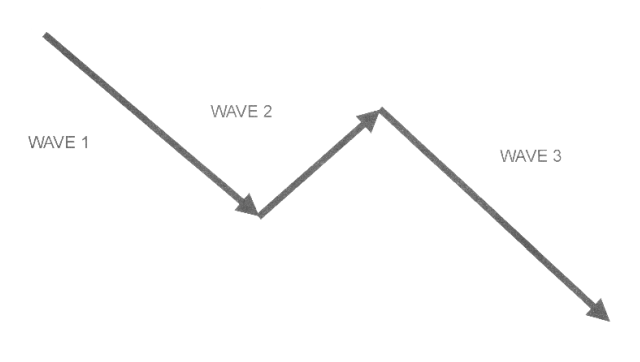
The
same analysis can be made on trends in a downward direction. A downward leg
will be followed with a bounce upwards. Then the final leg continues down to
test or breach the recent low, fig. 3.
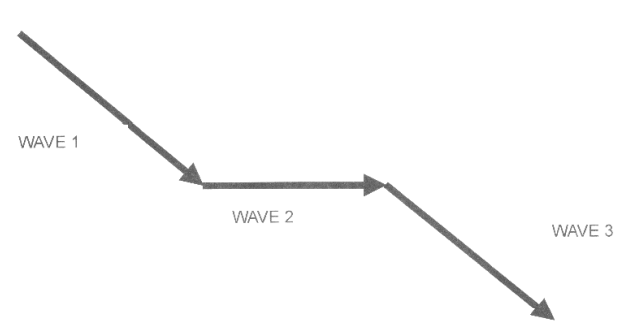
As
in the upward trend, a three-wave pattern can be a down leg, a flat trading
area, followed by the next leg to the downside as shown in Fig. 4.
Anticipating
how a wave pattern is developing provides the candlestick investor with
valuable information. It allows for the potential viewing of candlestick
signals at specific times, knowing that a leg of a wave pattern is forming.
This may seem very elementary However, with the well-established knowledge
that prices move in waves; then being prepared for a candlestick signal and a
new leg of a wave pattern creates excellent timing characteristics.
Does
a three-wave pattern always perform clearly? Not always, but often enough to
know to start looking for the next pattern. Keep in mind, the candlestick
signals are the main parameter for entry or exiting a trade. The wave pattern
is to provide a game plan for when those signals could appear. The advantage
provided by candlestick signals is the more defined reversal points. Whereas
Elliot wave analysts may want to hold a position through wave one to five, the
candlestick investor has the advantage of selling at the top of wave one, then
buying back at the end of wave two, etc. This produces much better use of the
invested funds, not losing equity during the pullbacks.
“Think simple” as my old master used to say-meaning reduce the
whole of its parts into the simplest term, getting back to first principles.
Keep
your wave count simple. Profits are not made by being able to proficiently
count wave counts. Profits are made by effectively buying at the proper time
and selling at the proper time. Utilizing candlestick signals, then evaluating
what the wave movements might be, will greatly enhance your profitability.
Fig.
5-5, the Arch Coal Inc chart illustrates a three-wave pattern. Wave 2, the pullback
in early June has a clear support level probability, the 50-day moving average.
The Bearish Engulfing signal forming on June 2 becomes the obvious sell signal
as the stochastics have finally climbed into the overbought area.
The
50-day moving average becomes the obvious target. That target experiences some
indecisive candlestick signals at mid-June. The Doji/Harami, a small hammer
that goes below the 50-day moving average, then closes above the 50-day moving
average, and the Inverted Hammer/Doji, all trading at the 50-day moving
average, provides a visual evaluation that the Bears are having a difficult
time pushing the price below that level. The buying confirmation the following
day provides an excellent trade entry indicator. The low for that day also
touched the 50-day moving average before revealing that the Bulls had stepped
in.
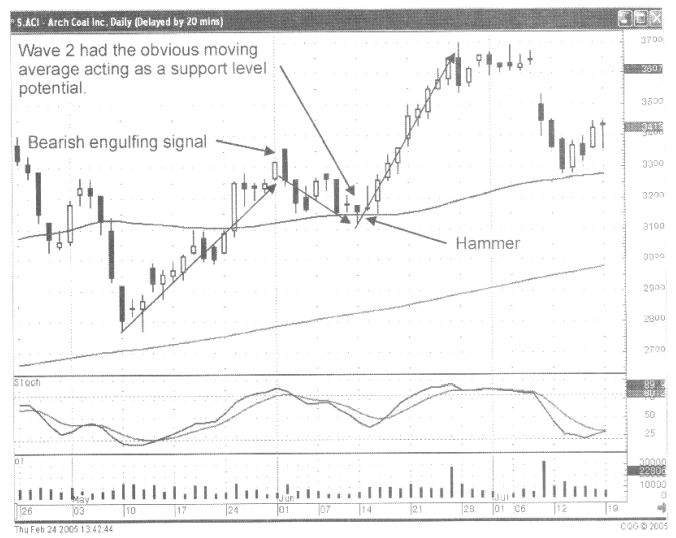
Fig.5-5
Arch Coal Inc.
These
signals, followed by a bullish trading day, caused the stochastics to turn up,
and provide a good visual picture of investor sentiment. This becomes a ‘buy5
area when analyzing that leg-three of a three-wave pattern could be developing.
The analysis becomes the anticipation that if there is no resistance at the
recent high, a good strong move could be occurring from these levels. The
upside potential is good. The downside risk is minimal. A close below the 50-
day moving average from this point would be the ‘stop.’
Fig. 5-6, The Biosante Pharmaceuticals Inc. chart demonstrates a three- wave pattern with a sideways movement. The series of Doji illustrate that although the buying had stopped; the selling pressure was not overwhelming. An investor may not want to sit through this period, having money exposed to a possible pullback. However, the bullish candle after the final Doji reveals which way investor sentiment wants to go after a flat trading period of indecision. If the position had been closed during the Doji, then buying back upon seeing the new buying strength, becomes a good decision anticipating that the third-leg of a three-wave pattern is starting.
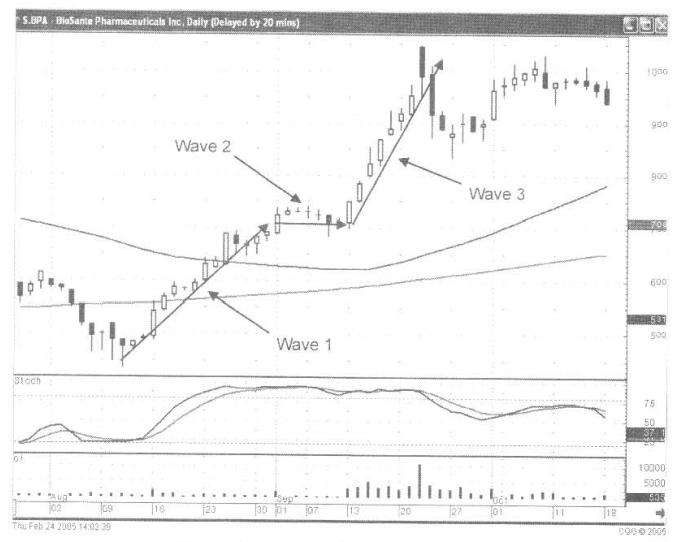
Fig. 5-6, The Biosante Pharmaceuticals Inc
Being able to analyze a sideways movement, after viewing a series of Doji, allows for an intelligent decision to be made. The end of the series of Doji was going to either reveal investors selling, creating a top, or a bullish signal would begin the formation of a three-wave pattern.
In
either case, an investment decision could be made with a high probability
outcome. This analysis is nothing more than being mentally prepared for what
could occur. Having been mentally prepared creates the opportunity to take
advantage of the next price move. The execution of the next trade can be done
quickly and decisively.
How To make High Profit In Candlestick Patterns : Chapter 4. Candlesticks with Technical Patterns : Tag: Candlestick Pattern Trading, Forex : Best trading pattern, Top 3 trading Pattern, Top trading pattern, Best candlestick pattern - Three-Wave Pattern