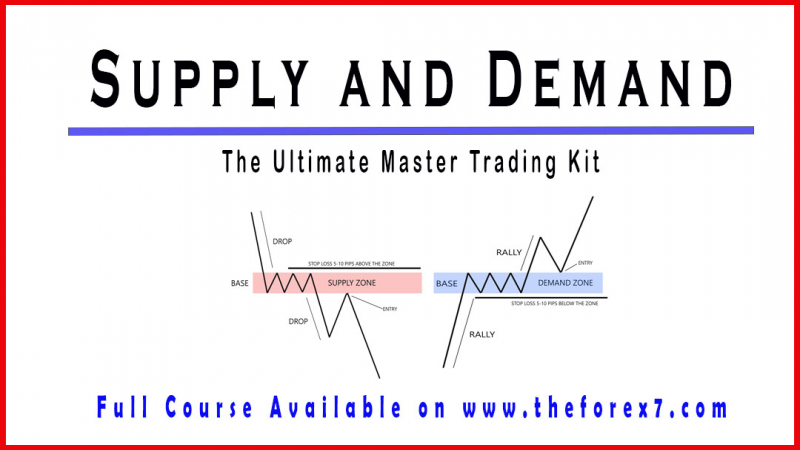
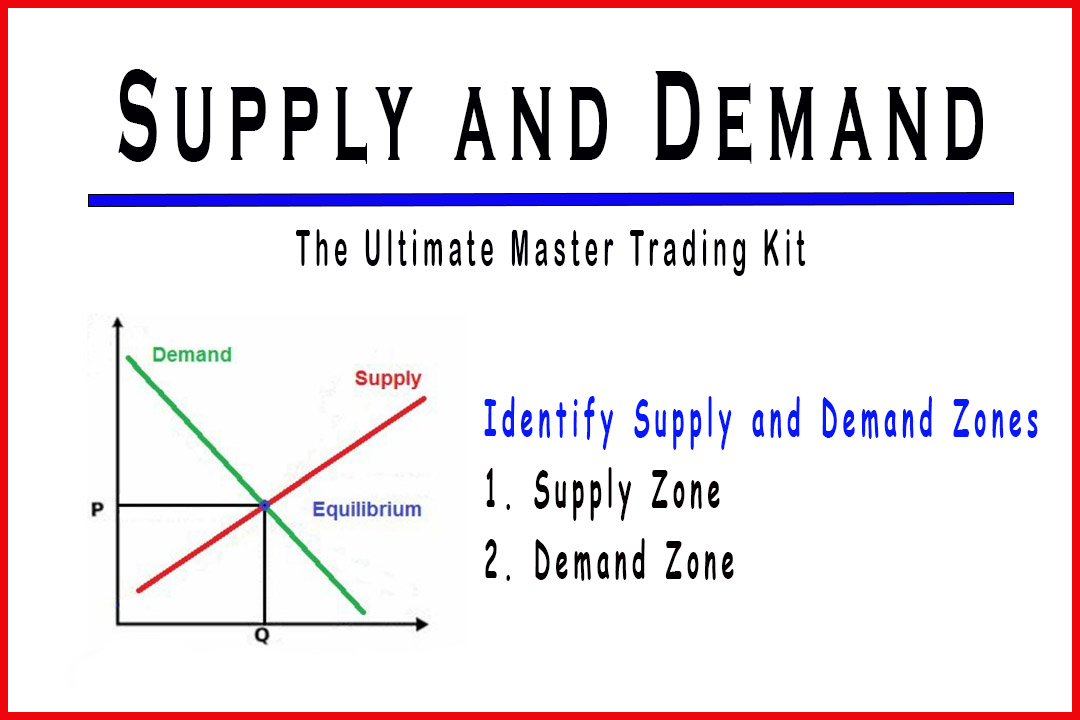
Identify Supply and Demand Zones
supply and demand curve, how to identify trading opportunities, Supply Zone, Demand Zone, Order flow
Course: [ Supply and Demand - Trade Like a Pro : Chapter 2. Executing the Strategy ]
In order to move price on a chart, there must be willing sellers and willing buyers. When you sell a currency pair, let’s say EURUSD you are selling Euro to a buyer or buyers willing to buy Euro from you, and buying U.S. dollar from a seller or sellers willing to sell it to you.
Identify Supply and Demand Zones
In order
to move price on a chart, there must be willing sellers and willing buyers.
When you sell a currency pair, let’s say EURUSD you are selling Euro to a buyer
or buyers willing to buy Euro from you, and buying U.S. dollar from a seller or
sellers willing to sell it to you. If there are no sellers and no buyers in the
market, the price won’t move and no transaction will take place.
There are
many players placing trades in the market, which make up the “order flow”. These include retail traders,
such us yourself, independent and private traders, institutions and
professional traders.
The
institutions and Hedge Fund Managers are very important because they have big
money. Professional traders understand how the Financial Markets work. They
trade in the opposite way to the way in which retail traders do things. That
explains why only 5% of retail traders make money in the Forex market. Because
only 5% know how to trade like professional traders.
The 90%
of the retail traders do not know how the Financial Markets work. And most
importantly, they trade using indicators and robots and they end up operating
in the opposite way in which professionals trade.
By
learning how to trade the market using supply and demand, you will be able to
enter the market at the same time as professionals and institutions do. We
cannot know with certainty where they are placing their orders, but we can use
supply and demand to locate high probability areas where big chunk of order
flows are still unfilled.
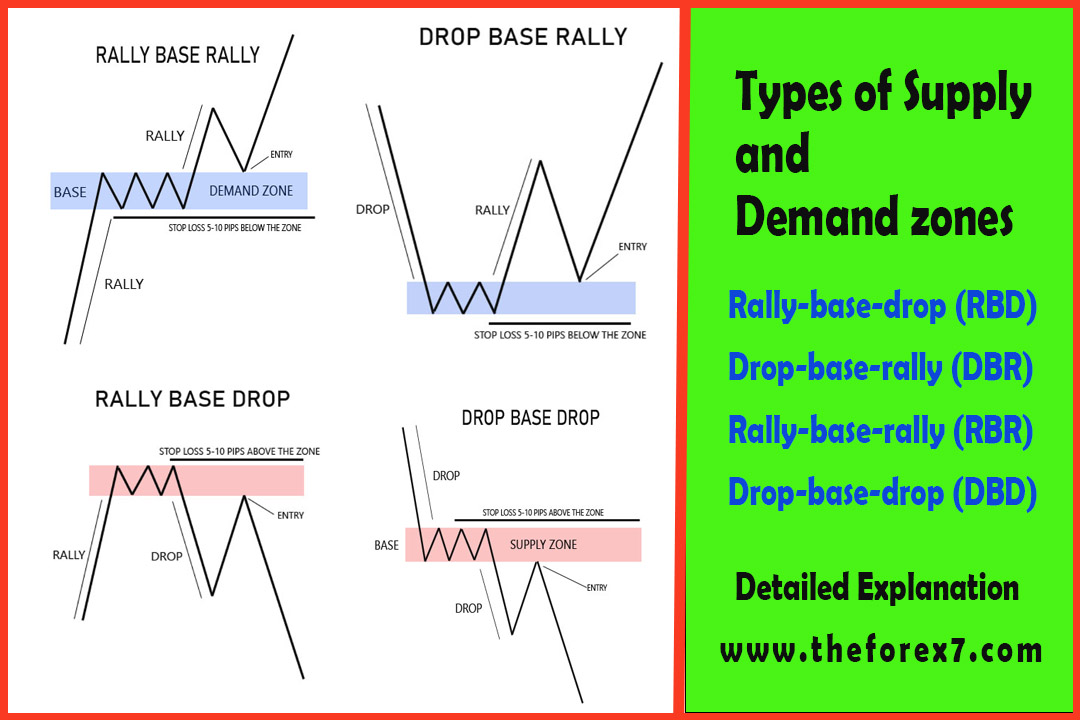
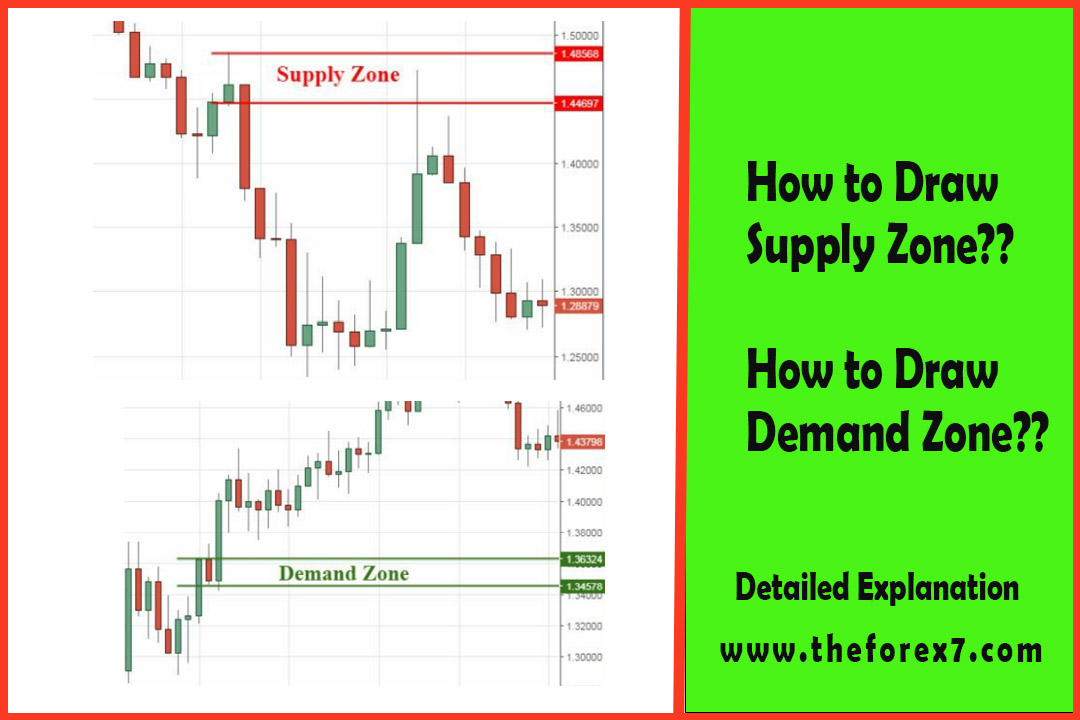
Supply Zone:
In the
chart below, the price dropped rapidly after making a small pause
around
1.13237 and 1.13874 (figure 21). The red rectangle on the chart represents the
area where institutions and professionals are placing their orders and that is
what caused the big drop in price.
Notice at
the far left of the trend, the market was in an uptrend and then started going
down. Retail traders will think this might be a pullback so they enter long
position at that area.
The
question that we need to ask ourselves is from whom retail traders are buying
EURUSD? They are buying it from Institutions and Professional Traders that are
selling it to them in order to short the market and therefore, go against the
retail traders.
No one
would think that we need to go short at that particular price level, because
conventional technical analysis states that we need to trade with the trend and
not the way around.

Fig.21.
Supply Zone.
The red
rectangle represents a pile of sell orders, which is where we are looking for
trading opportunities. The imbalance is created by the increasing number of
sellers over buyers, and therefore, the sellers are taking control of the
market and buying at this price level will be a bad idea.
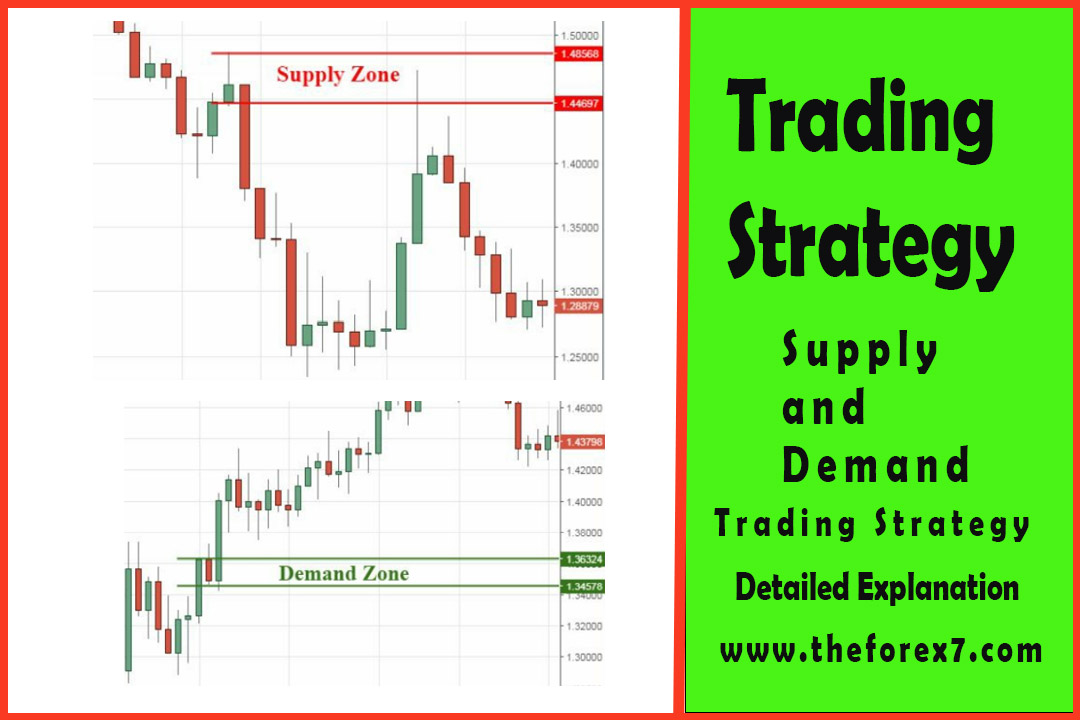
Let’s
place a sell order at this supply zone around 1.3237, and wait for the price to
return and test the level.
On the
next chart, we can see that the price did actually return to the zone and
triggered our order (figure 22). The trade worked out perfectly and the price
dropped to approximately 1.08100. That is a very profitable trade with low risk
and high profitability of success.

Fig.22.
Price returned to the supply zone and hit the limit order.
Demand Zone:
In figure
23, the price created a demand level between 118.772 and 120.230. This is where
we need to look for opportunities to go long.
The small
green rectangle on the left represents the area where institutions and
professionals are placing their orders and that is what caused the big rally in
price.
In late
February, the market created a nice big bearish candle. Retail traders would
consider this a confirmation to go short, but things went a little different
and the market went up. The imbalance is created by the increasing number of
buyers over sellers, and therefore, the buyers are taking control of the market
and selling at this price level will be risky. Again, who’s going to sell here,
of course the retail traders, and the buyers are institutions and professional
traders.
Let’s
place a buy order at this demand zone at 120.230, and wait for the price to
return and test this level. The price returned to the zone and triggered our
buy order. The trade worked out perfectly and the price rallied to almost reach
131.000. That is again a very profitable trade with low risk and high
profitability of success.

Supply and Demand - Trade Like a Pro : Chapter 2. Executing the Strategy : Tag: Supply and Demand Trading, Forex : supply and demand curve, how to identify trading opportunities, Supply Zone, Demand Zone, Order flow - Identify Supply and Demand Zones