How Do You Choose High Probability Zones?
Fresh Level Zones, Original Level, What Is a Fresh Level, Overlapping Zones, Supply or demand zone
Course: [ Supply and Demand - Trade Like a Pro : Chapter 2. Executing the Strategy ]
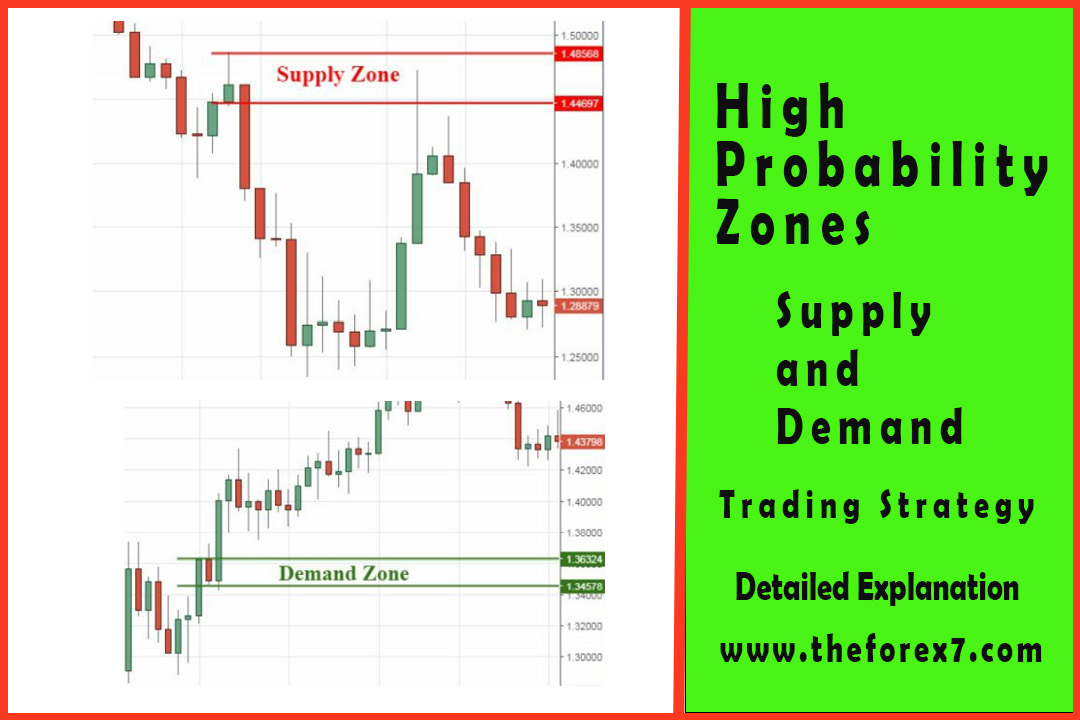
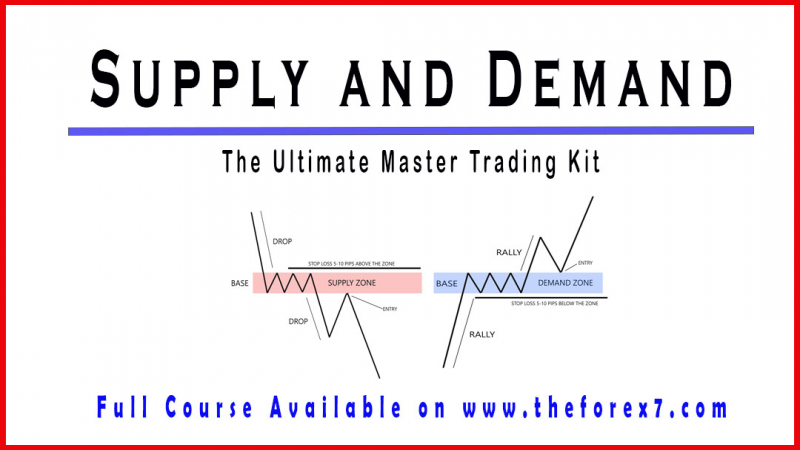
Trading with supply and demand can be extremely rewarding if you follow the strategy and enter the market at the right time.
How Do You Choose High Probability Zones?
Trading
with supply and demand can be extremely rewarding if you follow the strategy
and enter the market at the right time.
Most
traders fail to make money, because they trade what they believe instead of
what they see. No matter what strategy you are using, if you have no patience
and no discipline, you will always lose in this business.
Now that
you know how to find and trade supply and demand zones, let’s see how you can
filter these levels and choose only those with high probability of success.
I am
going to share with you a few tips to increase your odds of success and be able
to make money in Forex market.
Fresh Level vs Original Level
1.
What Is a Fresh Level?
A fresh
level simply means that the price has not returned to test the supply or demand
zone. Once the price retests the zone, the level is no longer considered fresh
and it is called non-fresh level. If the price keeps returning to the same
level, we say that the level is used up, in other words, if we enter a trade at
that level our chances of winning are down to zero.
We need
to choose fresh supply and demand levels to increase our chances of making
money. By eliminating those non-fresh and used up levels, we have increased the
odds of winning the trade.
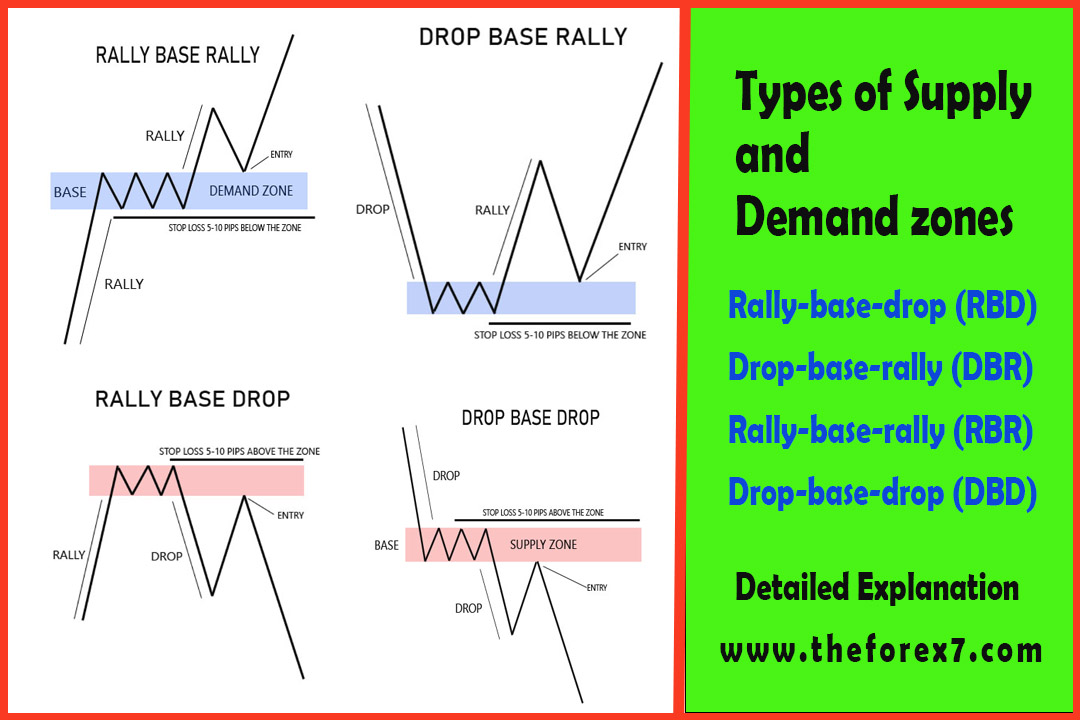
Supply
and demand levels can be either:
·
Fresh Levels,
·
Non-Fresh Levels, or
·
Used up levels,
2.
How to tell if your level is
fresh, non-fresh, or used up?
All we
need to do is:
1.
Find our supply or demand zone,
2.
Look right to see if the price
has or has not touched the zone,
3.
If the price has not touched it
then the level is fresh, if it did touch it once then the level is non-fresh
and if it touched it more than once then the level is called used up.
So as a
rule of thumb, if you have a supply or a demand zone and you find out that it
is not fresh, you need to forget that zone and look for another opportunity.
You could trade a non-fresh level, but again our goal is to look for the high
probability setups and non-fresh levels might not work for you all the time.
Let’s see couple of examples:
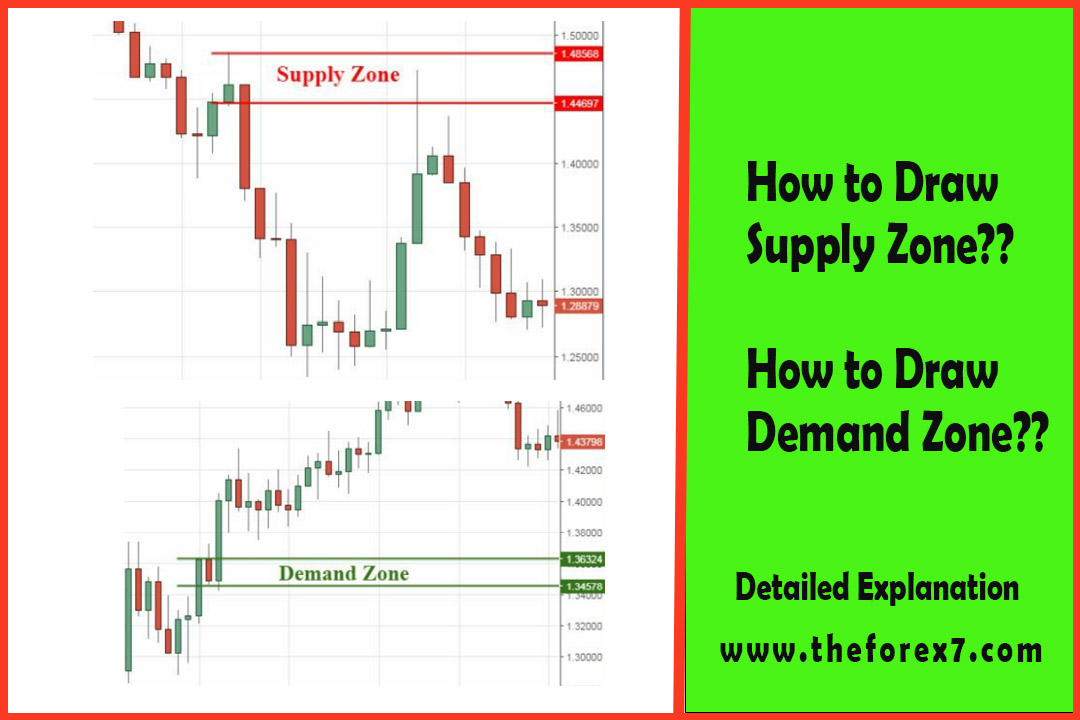
The next
chart shows a fresh supply level (figure 48). By looking to the right of the
supply zone we identified, we notice that the price has not pulled back yet to
test the zone, and therefore, the supply zone is considered fresh.
Same
thing for a demand zone, we look to the right and see if the price has pulled
back to test the demand zone. In the next chart (figure 49), we can see that
the price in an uptrend and as it goes up, the price is creating new fresh
demand zones. If the price pulled back to these zones (figure 50), they will be
considered non-fresh or used up (if the price tests the zone more than once).
Now let’s
see examples of non-fresh and used up levels:


3.
What Is an Original Level?
An
original level is a level of supply or demand that are created from nowhere, in
other words, it is a level that is not caused by any previous level (figure
51).
4.
How to tell if your level is
original or not?
We look
to the left side of the chart and we draw a horizontal line from our zone and
we scroll to the left until we touch a candle. If the candle is a part of a
previous supply or demand zone, then our zone is not considered original.

Overlapping Zones
The most
significant areas of the chart are “overlapping zones”. The multiple time frame
analysis gives us the possibility to spot high probability supply and demand
zones. If the zone on a smaller time frame chart coincides with a level on a
larger time frame chart, then the probability of that zone working out is very
high (figure 52). The higher the number of overlapping zones, the better the
probability of success at that level.

Sometimes
we can have overlapping zones in the same time frame, which is also a strong
confirmation signal to trade that level (figure 53). We have two supply zones
one below the other, both drop-base-drop type of structure, we notice that the
two zones are overlapping and when the price pulled back, it retested both the
zones. This created a very profitable setup to short the market. Look how the
price dropped from the supply zones.

In figure
54, the price pulled back to test the previous demand zone created a new demand
zone that overlaps with the previous one creating a good opportunity to go long
in this pair.

Reward-to-Risk Ratio
Not all
supply and demand zones work out a 100% of the time, that why we need to filter
them to increase our profitability on the market.
The
reward-to-risk ratio gives an idea of how the trade could work out. Once we
locate a supply or demand zone, we need to calculate our reward-to-risk ratio
before opening the trade.
A ratio
of 3:1 reward-to-risk ratio is a perfect ratio, because we are risking 1 to
gain 3. For example, if my trade has 10 pips stop loss, then my target should
be at least 30 pips away from my entry point. If the market doesn’t give us a
3:1 ratio, we stay away from the trade and we look for another one offering 3:1
reward-to-risk ratio.
A 2:1
ratio is also a good ratio, and trades could work out just fine, but again we
are choosing high probability setups and leaving those with low rate of
success.


Supply and Demand - Trade Like a Pro : Chapter 2. Executing the Strategy : Tag: Supply and Demand Trading, Forex : Fresh Level Zones, Original Level, What Is a Fresh Level, Overlapping Zones, Supply or demand zone - How Do You Choose High Probability Zones?