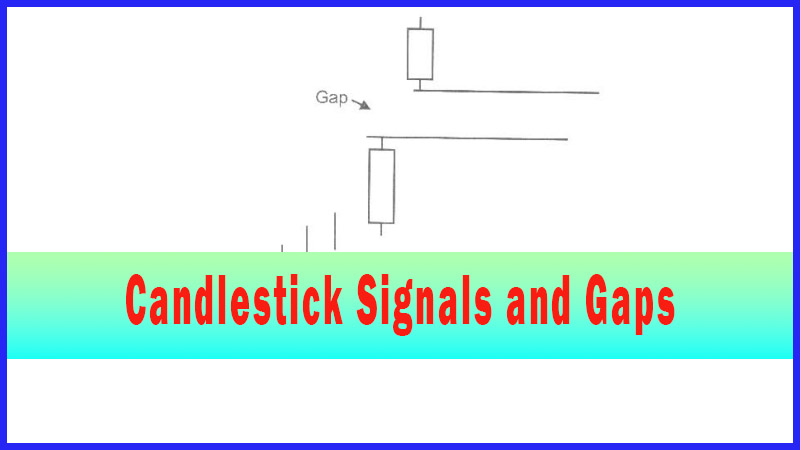
Gaps Down at the Top Candlestick
candlestick chart gap top pattern, Gap-up, Gap-down, High Profit pattern
Course: [ How To make High Profit In Candlestick Patterns : Chapter 3. High Profits Using Gaps ]

The same zeal illustrated when prices gap at the bottom is just as relevant at the top. A candlestick “sell” signal, when stochastics are in the overbought condition, followed by a gap down, clearly illustrates the sellers wanting to get out of that position aggressively.
Gaps Down at the Top
“If you want to know what’s happening in the market, ask the
market.”
The
same zeal illustrated when prices gap at the bottom is just as relevant at the
top. A candlestick “sell” signal, when stochastics are in the overbought
condition, followed by a gap down, clearly illustrates the sellers wanting to
get out of that position aggressively. For those investors that want to find
strong short positions, a gap down at the top provides strong shorting
opportunities. The same confirmation that is applied to a bullish signal can be
applied to a bearish signal. Prices, gapping away to the downside after a
candlestick sell signal, provide the additional confirmation that the downtrend
will move with good force.
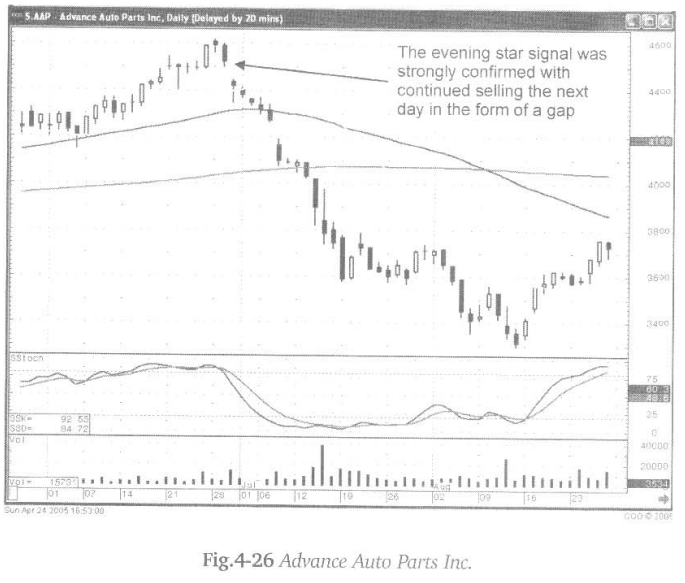
Fig.
4-26 (following page), The Advanced Auto Parts Inc. chart demonstrates that
investors are very anxious to get out of the stock. The appearance of the
Evening Star signal produces the first indication that the sellers were
stepping
in. The gap down makes it visually obvious that investors wanted out of this
position in a hurry. If you are planning to short positions, you want to find
those positions that are demonstrating strong downside potential. A second gap
down moves prices significantly below the 50-day moving average, clearly
illustrated the downside selling force is reasonably strong.
Doji
at the bottom are powerful indicators when followed by a gap up. The same is
true when witnessing Doji at the top. Fig. 4-27 (following page), The Placer
Dome Inc. chart clearly demonstrates a period of indecision with a series of
Doji in the overbought condition. Notice how the gap up created the series of
Doji, a flat trading range of indecisive signals. The new trend started to the
downside with a gap down bearish candle that immediately breached the 50- day
moving average.
This
chart pattern reveals an immense amount of information. The gap down bearish
candle provides information needed to make an important short decision. The
sellers want out of this position with great vigor. The 50-day moving average
appears not to be a support level. The two weeks of Doji type trading started
after a gap up. The gap down created an island reversal which is a very strong
reversal signal. Numerous indecisive trading days foretell a strong downtrend.
The bigger the number of indecisive signals, prior to a gap down in a trend,
the stronger the new trend will be.
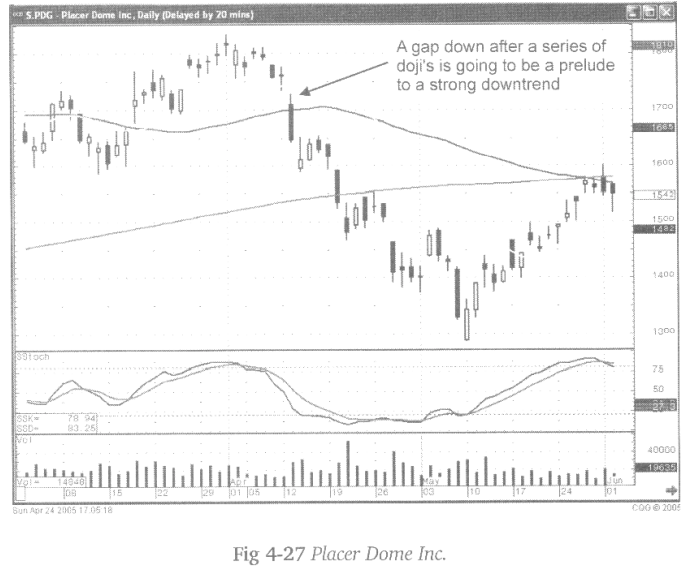
Fig.4-28,
the Legg Mason Inc. chart has the downtrend confirmed, after the Bearish
Engulfing signal at the top, with the appearance of a gap down. Although the
downtrend had temporary support at the 50-day moving average, there was a gap
down after the candlestick reversal signal. This should have indicated the
potential of additional selling. Until the stochastics had gotten into the
oversold condition, an extremely strong candlestick ‘buy’ signal would have
been required to negate the implications of the gap down.
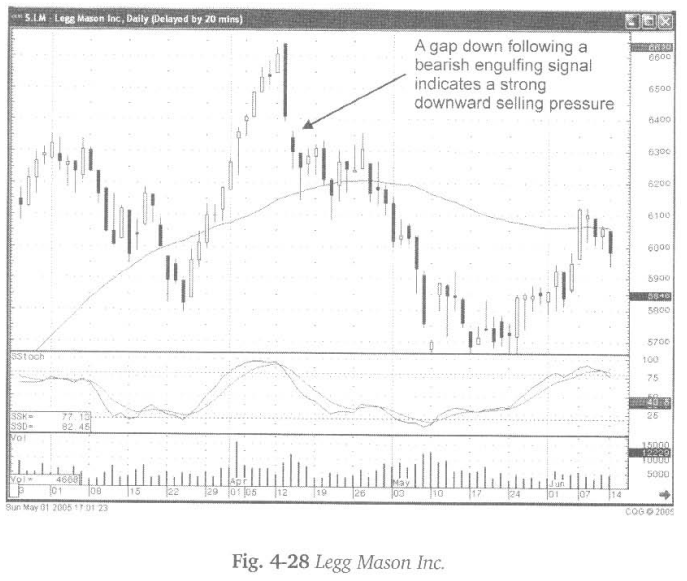
A
gap down informs the investor that there is a selling force that is usually
stronger than just a downward trend force. That information becomes built into
the analysis. What will a trend do if it hits a support level soon after the
gap down? As seen in the Legg Mason Inc. chart, what could be some consolidation,
at what would be considered a support level, does not have any strength in the
follow-through buying. A gap down indicates that the selling pressure should be
substantial.
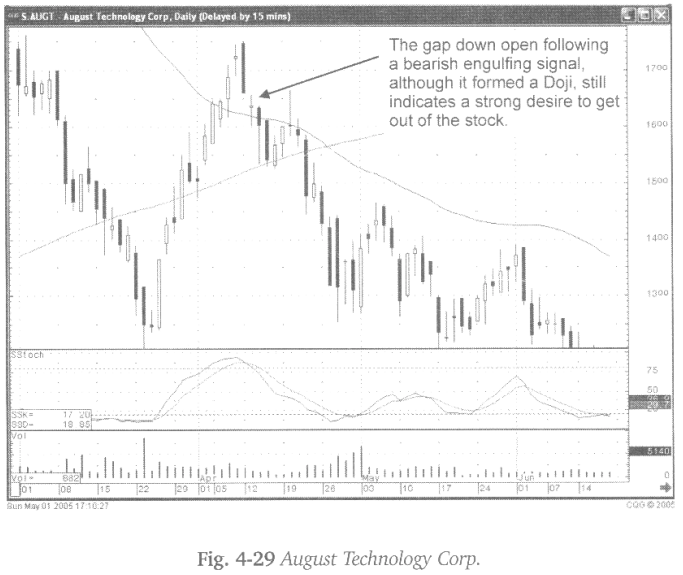
Fig.
4-29, The August Technology Corp. chart reveals the same type of pattern, a
Bearish Engulfing signal followed by a gap down the next day. As illustrated in
the previous chart describing a Doji, it is not unusual to see a Doji day after
a reversal signal. This is the Bears conflicting with the last of the Bull
buying after the signal. The fact that the open gaps down from the close of the
Bearish Engulfing signal should immediately reveal that the sellers are anxious
to get out of the stock.
Being
able to identify a candlestick reversal signal produces the visual advantage
that the non-candlestick analyst does not have. Witnessing a gap down from a major
signal formation provides much more confirmation.
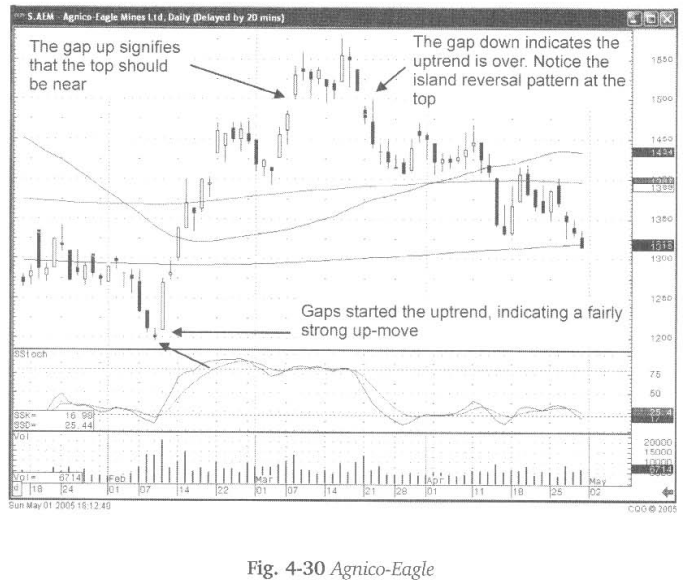
Fig. 4-30, The
Agnico-Eagle Mines Ltd. chart reveals the strength in which the sellers want to
get out of the stock. The large Doji signal, followed by a gap down in price the
next day, was a signal that the uptrend was over.
Use
a gap down at the top as a profitable indicator. A gap down indicates that the
sellers are moving the downtrend with force. Especially when seen in overbought
conditions, a gap down produces an extremely high probability that the existing
uptrend has now been reversed. The downtrend is going to move with significant
strength.
How To make High Profit In Candlestick Patterns : Chapter 3. High Profits Using Gaps : Tag: Candlestick Pattern Trading, Forex : candlestick chart gap top pattern, Gap-up, Gap-down, High Profit pattern - Gaps Down at the Top Candlestick