Track and Chart your Trades
Money management, Risk management, Risk Reward Ratio, Track Trade Results
Course: [ The Candlestick and Pivot Point Trading Triggers : Chapter 12. Confidence to Pull the Trigger Comes from Within ]
A trading diary is a great way to check and confirm your trading execution entries and exits. In fact, most charting software has the capability to go back to see when you executed a trade.
TRACK AND CHART YOUR TRADES
A trading
diary is a great way to check and confirm your trading execution entries and
exits. In fact, most charting software has the capability to go back to see
when you executed a trade. Think what this can do for a trader. If it is
followed properly, it can and most likely will help you to improve to a new
level of self-discipline and ultimately lead to increasing your self-confidence.
How? If you execute when the signals call for action, you can validate whether
you responded when called to do so. You can check your work. You will find out
if you hesitated when your methods called for you to exit and if you timed it
per the system or not. One lesson we teach our students at Trading Triggers
University is to save a chart and print it out with the entry scale-out and
exit. Printing the chart out helps you to see clearly how you respond or react
to the trade signals. It will reinforce the validity of your system or any
system, including my Defcon program with Genesis Software. By printing out and
cataloging your trades by a chart, you will gain more experience in identifying
the patterns that drive your trading signals. It also keeps track of or “inventories” what went right or what went wrong with a trading
plan. It will allow you to study and examine the results in black and white. On
successful trading days, it will be good to capitalize on your successes so
that they can be repeated. Of course, on bad days, it can allow you to focus on
what went wrong so that you can understand and improve on it so that you stop
repeating the same mistakes over and over again.
TWO CASES IN POINT
If you
map out a game plan, trade off the “numbers,” or
have a trading system, when you print out your chart and examine your trades,
you are grading your own homework. I have posted on my web site a daily Dow
Report to which the Chicago Board of Trade links. Every day after the market
closes, I post two numbers based on my teachings and on what we went over in
this book.
Those
numbers are what I believe the high and/or low of the session will be; and
then, based on the market direction number, I will post a trade recommendation.
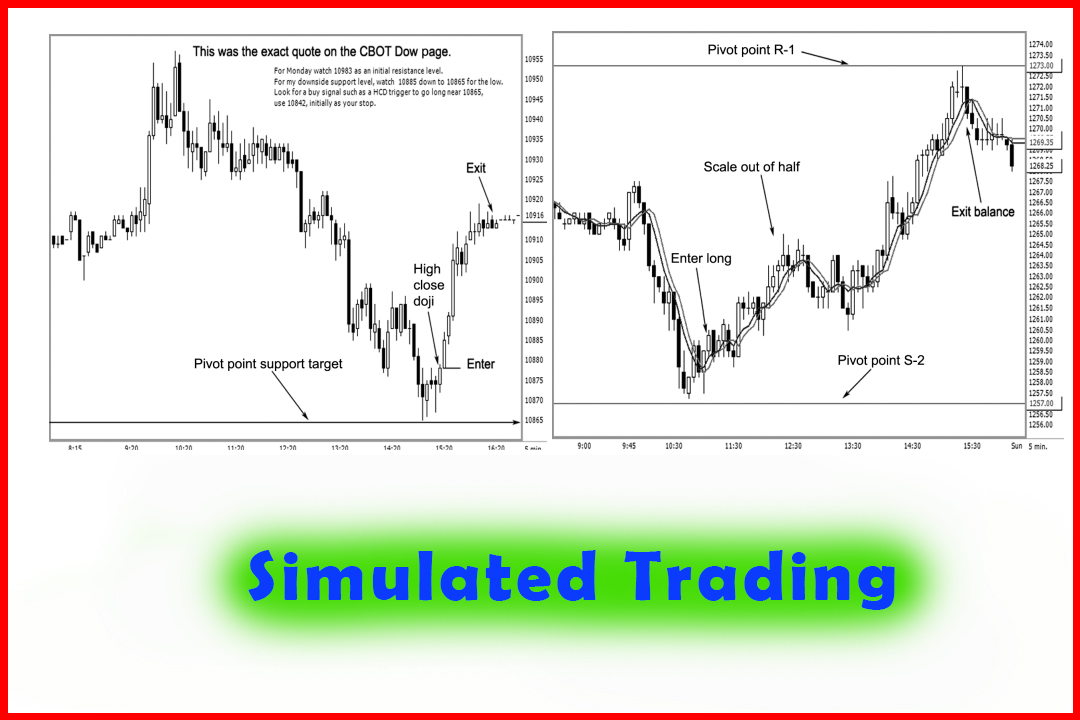
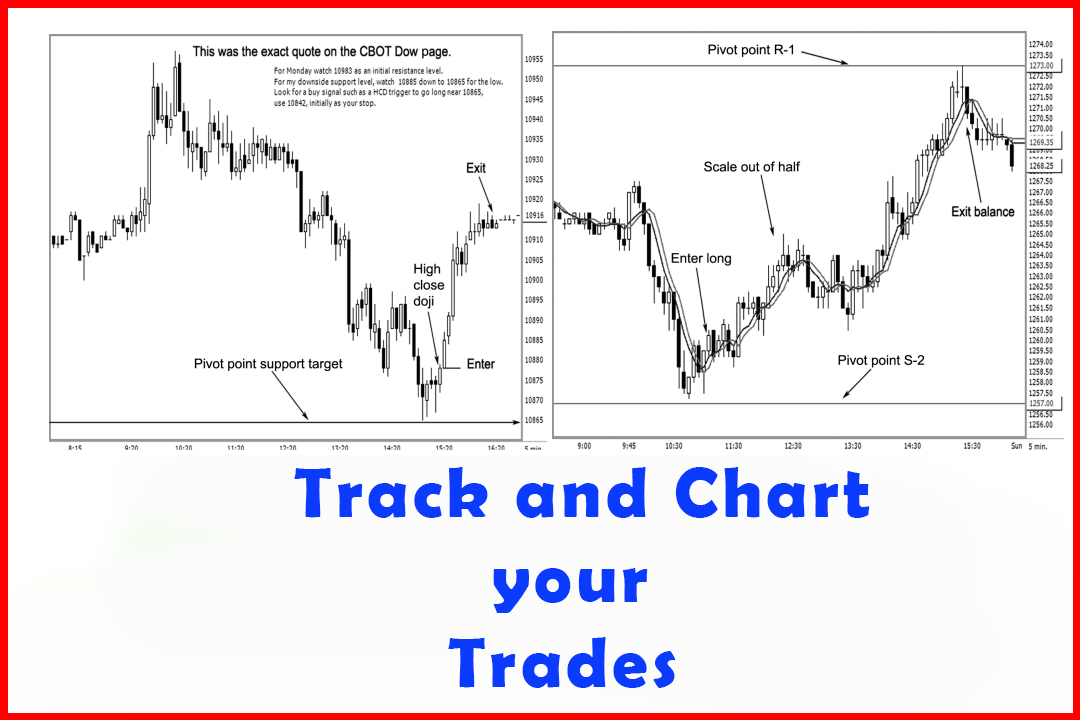
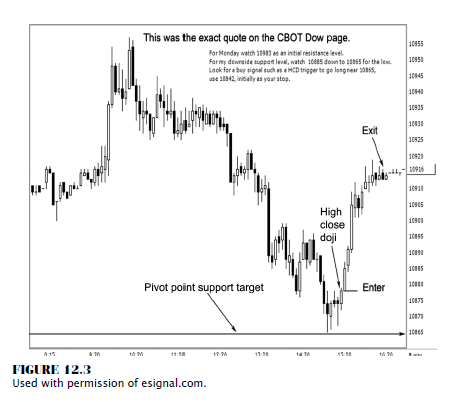
Figure 12.3 shows a direct quote that was for Monday, February 13, 2006. The
initial resistance level was 10983, and my target support was 10865. The exact
low was 10865, and a high close doji pattern formed.
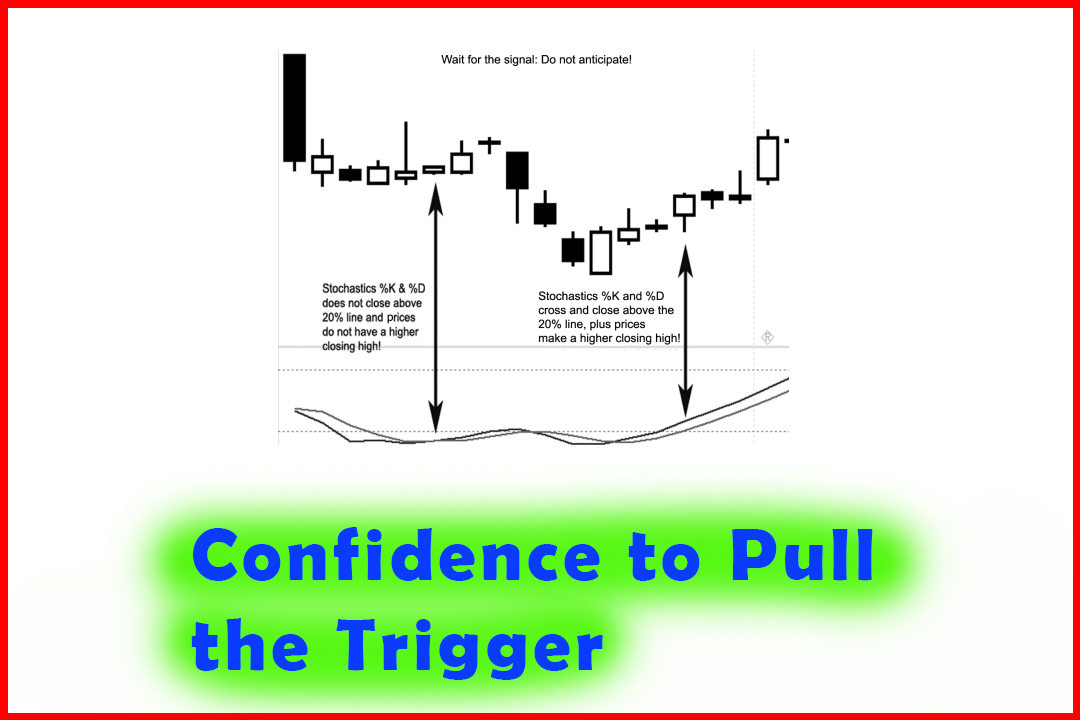
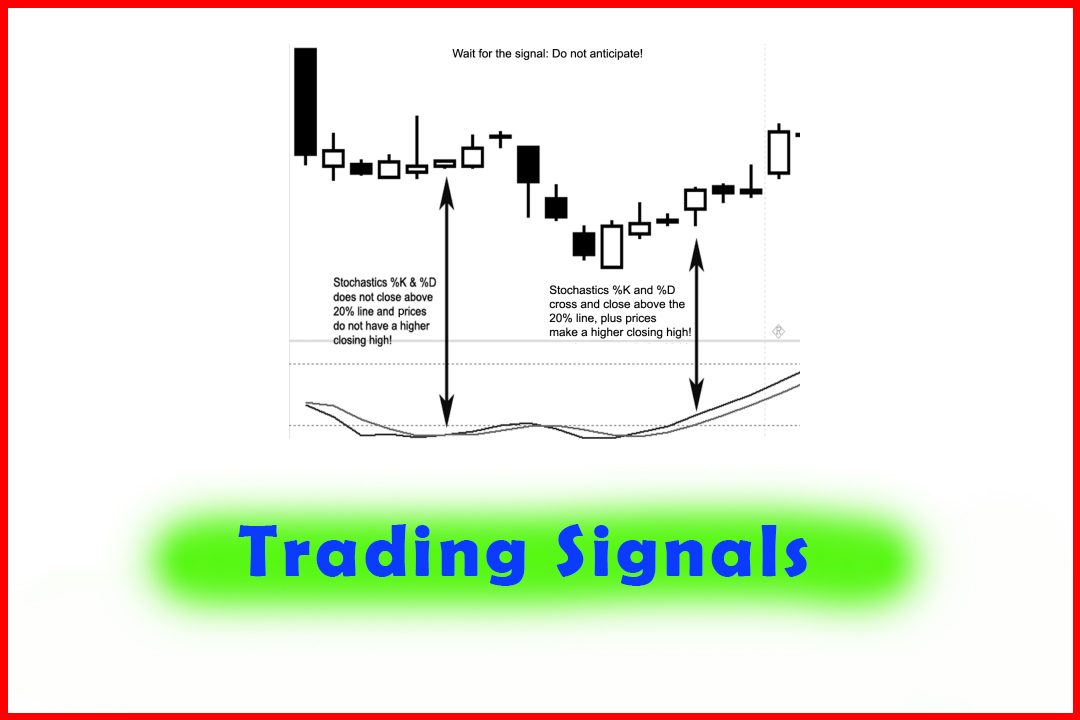
This is
not rocket science. Why would I state the day before what type of pattern to
look for and at what price? We know the reasons why I select a high close doji
trigger based on the statistical findings in Chapter 7. When I introduce two
other dimensional market analysis approaches, such as a moving average and
pivot point analysis, all you need is the patience to wait for the signal to
materialize. It is a high-probability setup; and in this case, the trade
resulted in a 38-point gain, or $190 per contract, in less than an hour. The
only drawback on this trade was that you had to wait until the end of the day
for it to materialize. No pressure, no worries, just profits. A nice trade. And
if you print out a chart and plot your entries and exits, you will begin to see
more clearly how a trade develops; and you will reinforce your subconscious
mind on what to look for in the next trade and improve your confidence from
within to win.
There are
many who visit my site just to see my numbers selection for the market. I also
include what the projections are for the week. For day traders and swing
traders, it helps them also identify a potential confluence support level based
on pivot point analysis. Feel free to visit and check the numbers yourself at
www.nationalfutures.com; just click on the link that says Daily Dow Report.
Even better: You now have your own Pivot Point Calculator, provided on the
accompanying CD to this book.
Another
case in point as to why it is helpful to print out and catalogue charts that
track your trades is that it will help you to visually back-test the methods.
The more you see the patterns recur, the more assurance you will have in the
methodology.
The topic
I covered in Chapter 5, demonstrating how to filter the pivot point price
projections, based on the moving average approach, gives me an edge by reducing
the noise or eliminating excess information. It helps me to narrow the field to
what the potential range might be of a given market for a specific time frame.
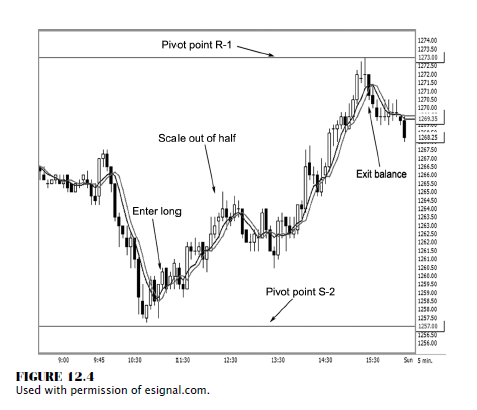
If I have a predetermined point of view that
the market might see a low of 1257 and a high of 1273, once I identify a
pat-tern and conditional change in the price action, I can enter a position. In
Figure 12.4, I have a trade example in the e-mini-S&P (Standard &
Poor’s) that demonstrates how the market was contained within the bearish target
selected pivot point numbers based on the system. Remember, if bearish, then
the target low will be near S-2 and the high will be near the first resistance
level (R-1). If you stick to the rules and look for buy signals near support
and sell signals near resistance, follow the game plan, add the other two
dimensional factors such as a high close doji or hammer pattern, with the
moving average indicating a conditional change, then you enter a position. As
the market starts to show momentum loss as indicated by shadows, scale out of
half of your positions, place a hard stop at breakeven, and then wait to see
the flow of the market. If you print out your chart and plot your entry price,
your scale-out price, and then the price where you exited on the balance of
your positions, you will not only grade the trading system but also your
performance and how you react to market conditions.
The Candlestick and Pivot Point Trading Triggers : Chapter 12. Confidence to Pull the Trigger Comes from Within : Tag: Candlestick Pattern Trading, Forex, Pivot Point : Money management, Risk management, Risk Reward Ratio, Track Trade Results - Track and Chart your Trades