Candlestick Entry and Exit Strategies
Candlestick signals, Candlestick analysis, Candlestick best entry setup, Candlestick best exit setup, Candlestick Trading Setup
Course: [ How To make High Profit In Candlestick Patterns : Chapter 8. Candlestick Entry and Exit Strategies ]
Candlestick signals tire in existence today because of their statistical probabilities. As can be imagined, the signals would not be in existence today if they did not produce noticeable profits throughout history.
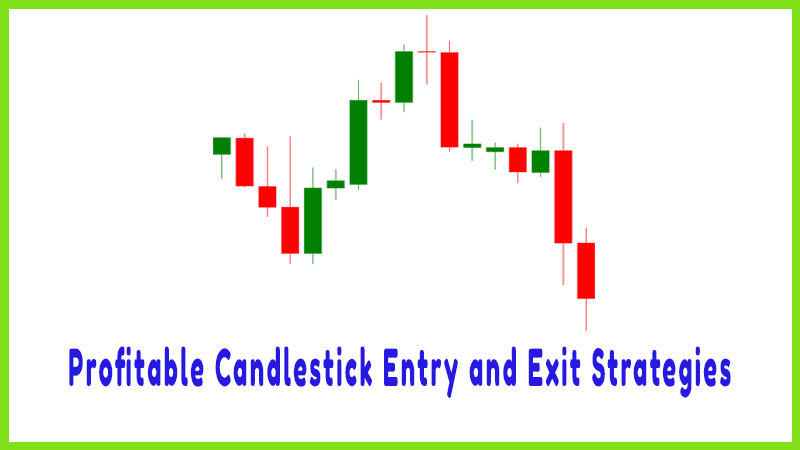
Profitable Candlestick Entry and Exit Strategies
“It is a great folly to struggle against such things as thou
const not overcome.”
Candlestick
signals tire in existence today because of their statistical probabilities. As
can be imagined, the signals would not be in existence today if they did not
produce noticeable profits throughout history. Profits showing significantly
more than random luck or normal market returns. The purpose for utilizing the
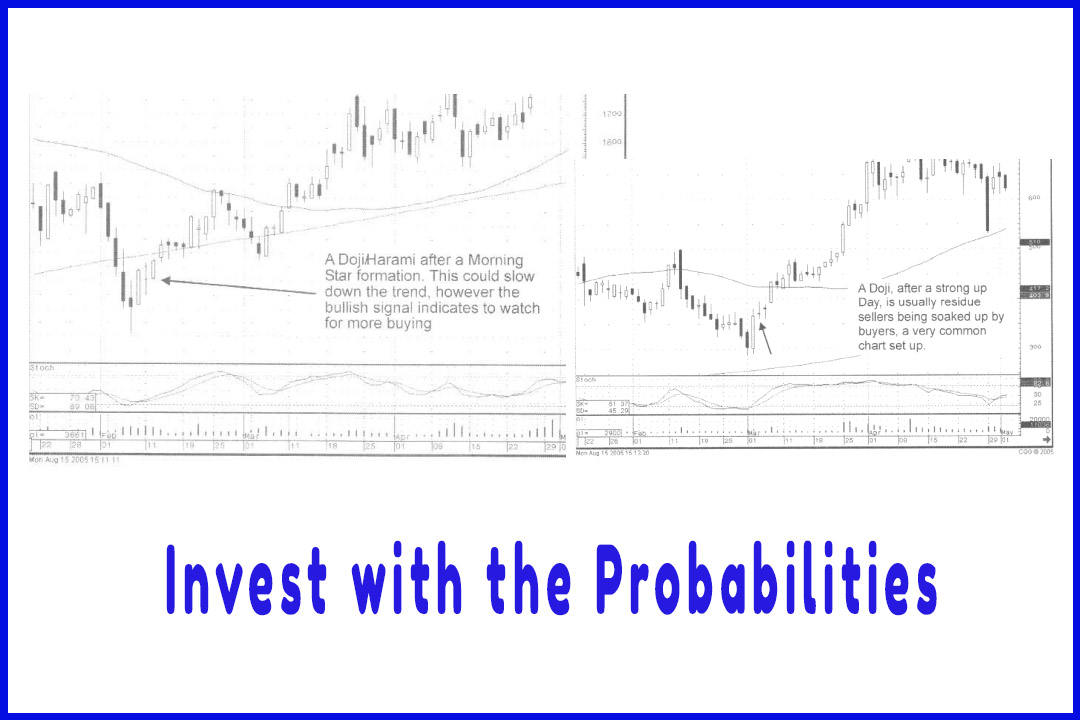
Candlestick signals is to put as many probabilities in your favor as possible.
The fact that a signal is still around is due to its observed results over
centuries. Assuming that the probabilities of making a profit from that signal
is above 50%, maybe 60%, 70% or even 80%, and those percentages can be enhanced
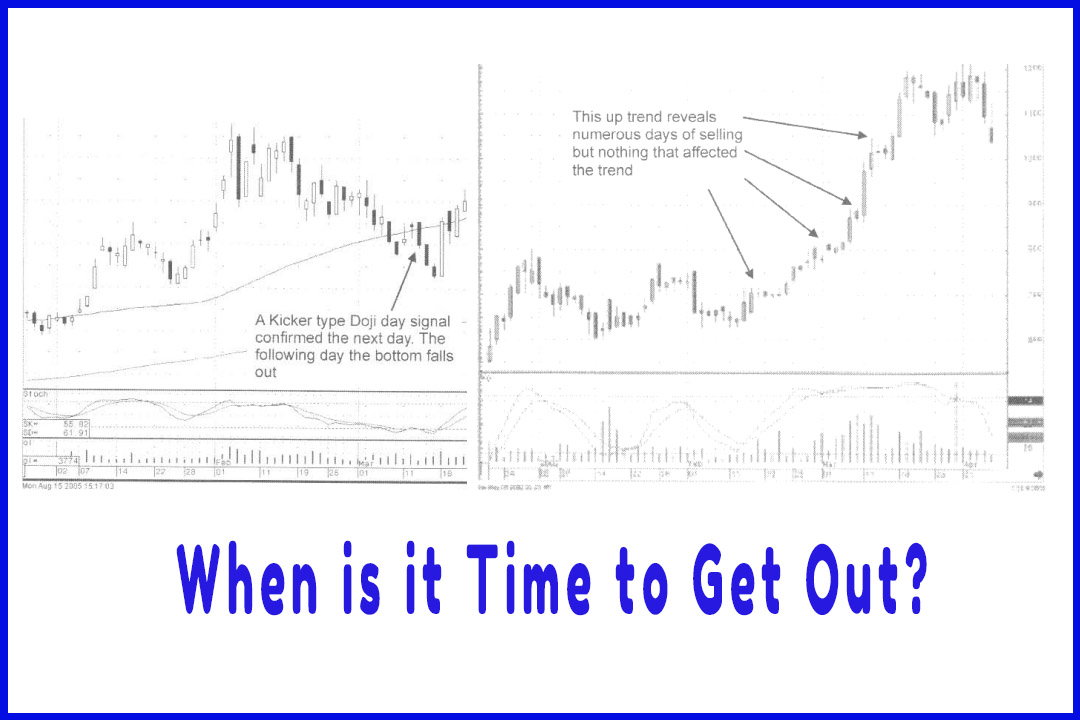
by an additional factor. The signals indicate when to get out of failed trades immediately,
thus cutting losses. (To date, statistical performance has been difficult
to obtain. The combination of severe misunderstandings of when a signal is
truly a signal by most investors has been a deterrent. That lack of knowledge
and the multitude of parameters required to do a statistical analysis makes
programming for statistical results an overwhelming task. What can be visually
accessed in the matter of milliseconds involves a multitude of numeric
calculations and parameters. The Candlestick Forum is currently directing
projects to accumulate these statistics and will make them available to
Candlestick Forum members as results are obtained. Because of the magnitude of
this project, information will most likely be released in bits and pieces as
completed.) How a position is performing, once the signal has appeared, is
an immediate filtering element. We are all eternal optimists and want every
position to go up as soon as we buy it. However, keep in mind, even with the
possible phenomenal results of 80% positive trades, that still leaves 20% that
will not work. The more steps taken to reduce bad trades, the better your
results will be in your investment funds.
The
information revealed in this book and on the Candlestick Porum website is not
the revealing of ancient “secrets” or the development of sophisticated computer-generated
formulas. It is the assembling of commonsense observations from centuries of
actual profitable experience.
Candlestick
information has been around in the U.S. investment arena for several decades.
Everybody knows about them. They use the candlestick graphics for better
viewing of charts. However, most investors do not know how to apply the signals
for effective results. You, taking the time and effort to research the
Candlestick method, are still in an extremely small minority of the investment
community. The Japanese rice traders made huge profits from the Candlestick
method. They used rice paper to draw charts and backlit the charts in candle
boxes. The concepts applied to Candlestick analysis eventually became the
backdrop of the Japanese investment culture.
Common Sense
As you
learn about the Candlestick method, keep in mind that the commonsense approach
is what distinguishes this investment technique from most investors trading
practices. The information you are receiving is knowledge that is available to
everyone. However, you have the benefit of learning the correct interpretation,
which means you get the desired results. Take advantage of this knowledge. It
will create a confidence in investing that most people never experience.
Just as
the signals produce valuable information as to when to buy a position, they
are just as valuable for demonstrating when to sell. This, sometimes, is much
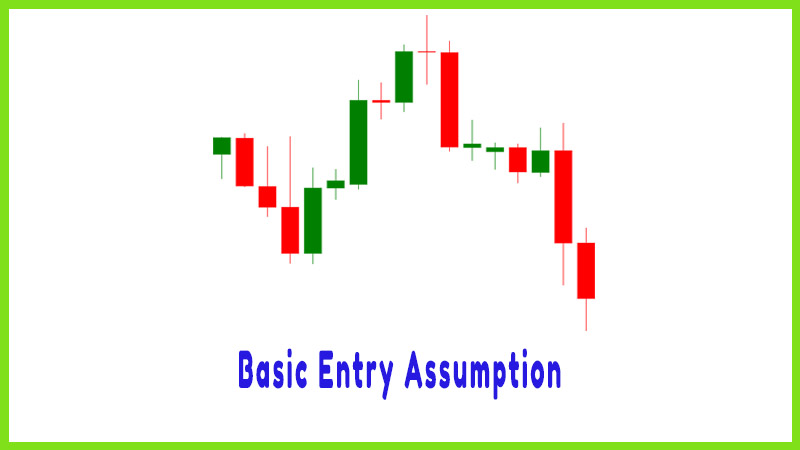
sooner than expected. Simple logic tells us that if a Candlestick “buy” signal
appears in the right place with the right confirming indicators, the trade
should have a high probability of being a profitable trade. Unfortunately, reality
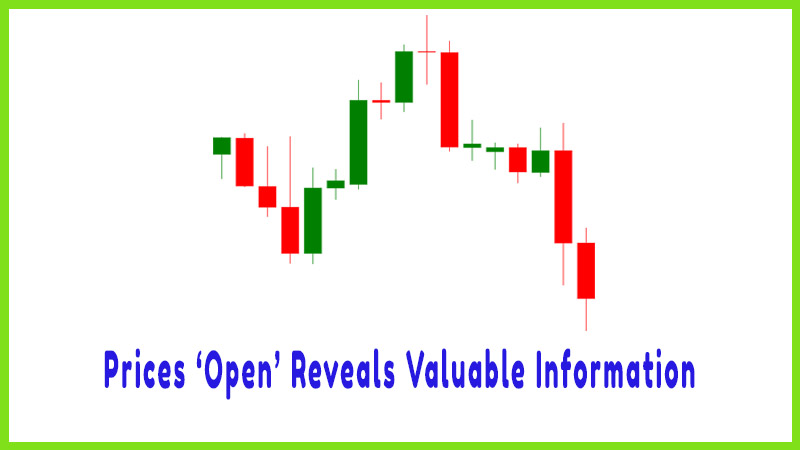
may show a different outcome. How a price ‘opens’ the next day is a very important
indicator as to how aggressive the buyers are. (The same parameters apply to
sell transactions, but for illustration, the buy side will represent all
trades.) Utilizing that information can be instrumental in weeding out less
favorable trades.
The logic
behind the results of an opening price the next day after a signal is simple.
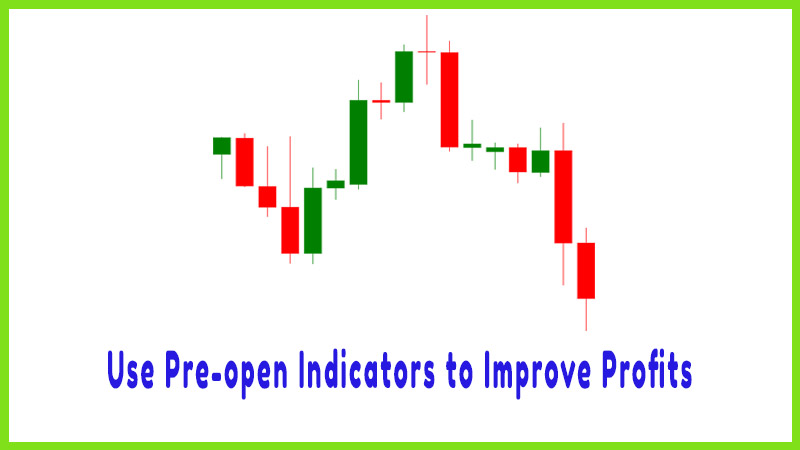
Is there evidence that the buyers are still around? That information is readily
available through inexpensive live-feed services. Being able to view how a
stock is going to open, before the market opens, improves an investor
positioning dramatically. Returns expand dramatically by eliminating bad
trades.
The
shorter the trading period, the more critical the ‘open’ pricing. Options are
trading vehicles that require as exact timing as possible. Longer-term
investors have more leeway when putting on a position. A six-month trade or a
one-year trade is usually being bought when the monthly, weekly and daily
candlestick charts all coordinate, each chart shows that it is time to buy.
(The monthly and daily charts are the pivotal charts for long-term investors.
The weekly chart is sometimes out-of-sync. It is better to do your own testing
with a four-day, six-day, seven-day, or eight-day chart. They may have more relevance
than the one-week chart.)
“Buy stocks that are going up; if they don’t go up, don’t buy
them.”
Each
formation is not a signal. A Candlestick “buy”
signal in the overbought area does not mean the same as a Candlestick “buy”
signal in the oversold area. Conversely, a Candlestick “Sell”
signal does not mean the same in the oversold area as it does in the overbought
area. Many investors confuse the formations as signals. They do not take into
consideration where the overbought or oversold indicators (Stochastics,
settings of 12,3,3) might be.
When do
most investors want to buy into a stock? They usually want to buy after the
price has gone consistently up for days or weeks! Finally, they become
convinced that the stock is going to go up forever. That is tire reason an
inordinate amount of volume appears at the tops. Finally, everybody has gained
enough confidence and wants in. After a sustained uptrend, the broadcasts begin
on the financial news stations. The “experts” discuss how great the company or
the industry is doing. The average investor perceives they will be left behind
if they do not get into the stock. Of course, that is usually the first sign
that the top is near. Prices start to pull back because of profit taking. The
new investors hang on anticipating the uptrend will continue after some profit
taking. However, the pullback lasts a few weeks longer than everybody expects.
Then it moves slowly up to the area that diose investors bought, bumps into
resistance, then pulls back again. Soon they are sitting in a stock they have
owned for three months where the price still is not back where it was bought.
This is not a good return on the invested dollars.
Alternatively,
the inexperienced investors are going to try another approach. They are going
to buy a stock that they have followed because it has pulled back a hefty
percentage. This is at least more logical than buying a stock because it has
gone up a great deal. However, this also has its flaws, if done without using
any buying parameters or signals. Enron Corporation is a prime example of not
buying a stock just because it has backed off a good percentage from its high.
The person, buying a stock without any buying signals because it has gone down,
is just grabbing for the fallen knife. One of three things can happen from that
point and two of them do not make you money. The price could easily continue
its downward trek. Buying because you think that the sellers have sold enough
may not be a viable approach. The stock price could level out and trade flat
for the next six months, not a profitable endeavor. Finally, because you have a
wonderful sixth sense, you happened to buy the stock at the bottom and it
turned up reasonably quick. If that is the case, you do not want to read this
book or any book that would screw up that talent.
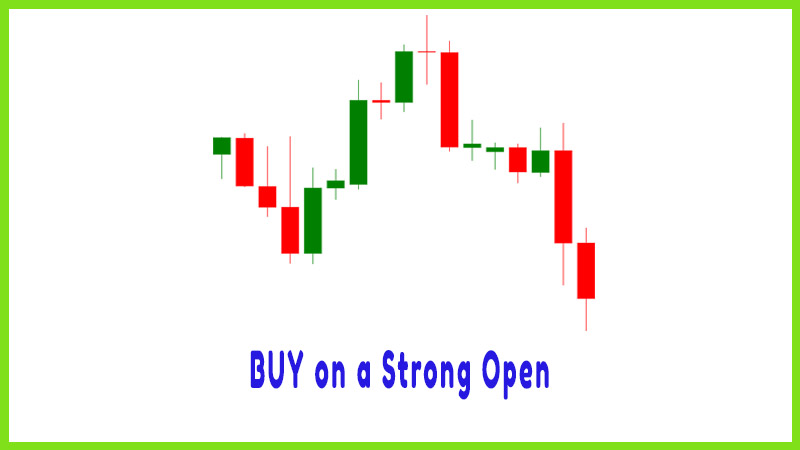
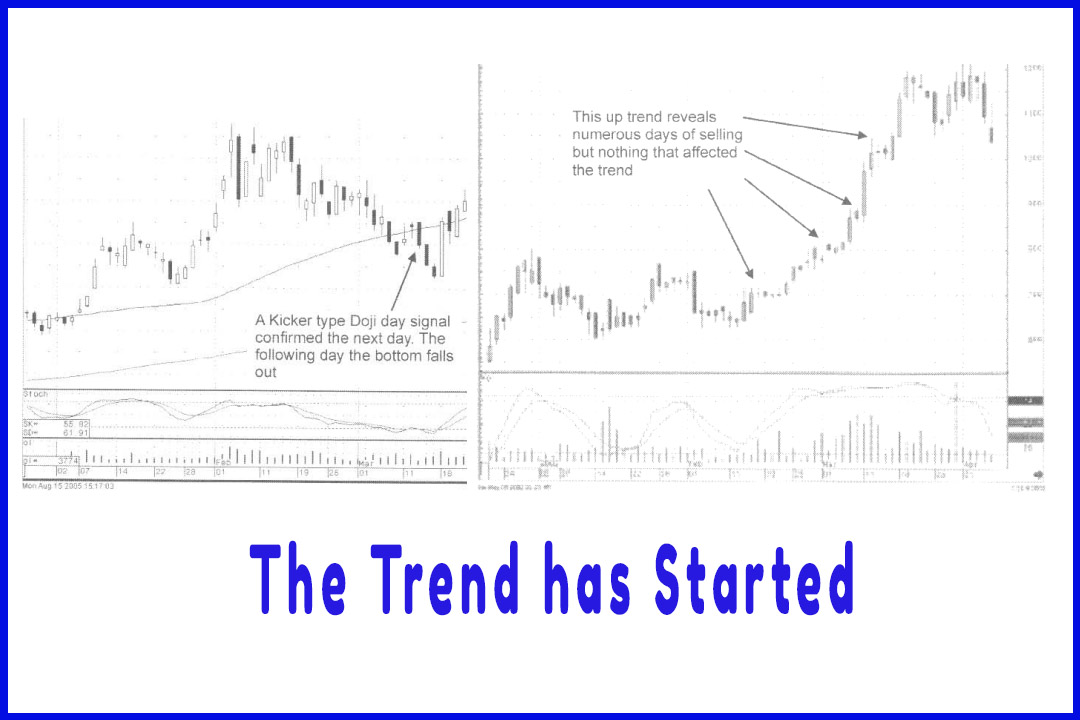
The best
investment strategy is to buy a stock that has bottomed and the buying is
becoming more prevalent. Tall order? Not really, when you can visually see the
buy signs. The probabilities are much greater to find the stocks that are just
starting to make an ‘up’ move. It is better to buy a stock where fresh buying
is recently coming into the stock and getting in on strength. Participating
with other buyers at least indicates that there are other buyers, logical! As
in the famous investment strategy of Will Rogers, “Buy stocks that are going up, if they don’t go up, don’t buy
them”. As backward as that philosophy appears in the
real world, the Candlestick signals get investors close to that concept.
How To make High Profit In Candlestick Patterns : Chapter 8. Candlestick Entry and Exit Strategies : Tag: Candlestick Pattern Trading, Option Trading : Candlestick signals, Candlestick analysis, Candlestick best entry setup, Candlestick best exit setup, Candlestick Trading Setup - Candlestick Entry and Exit Strategies