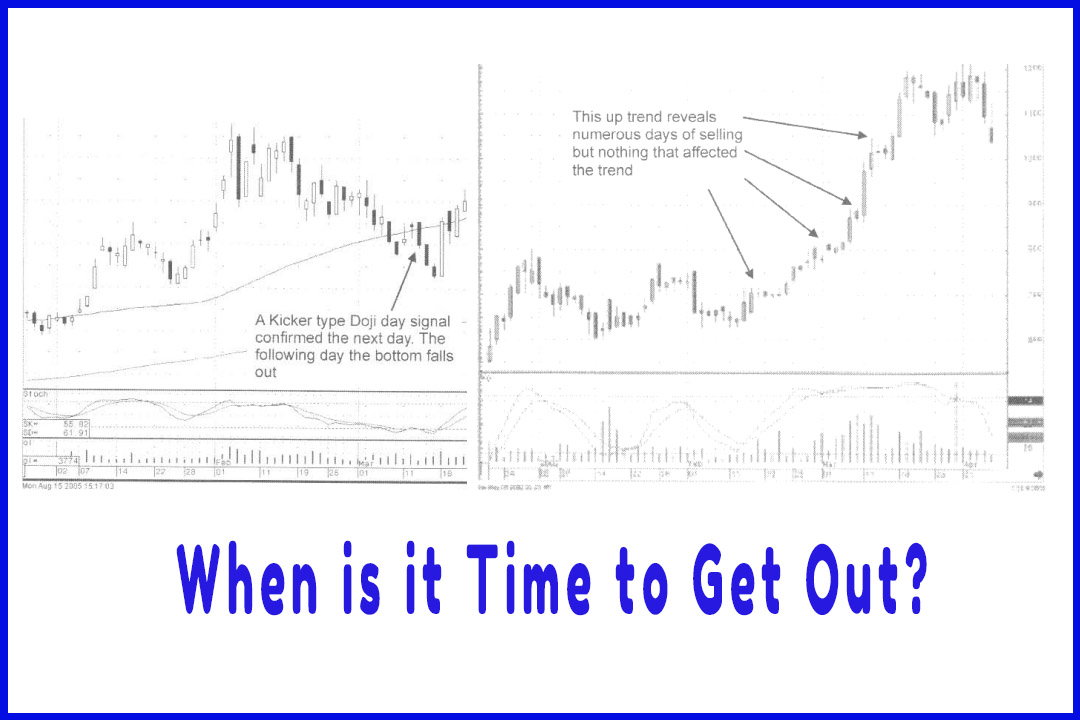
When is it Time to Get Out?
Single candlestick patterns, Types of candlesticks, Powerful candlestick patterns, Types of candlesticks, Candlestick chart analysis, Bearish candlestick patterns
Course: [ How To make High Profit In Candlestick Patterns : Chapter 8. Candlestick Entry and Exit Strategies ]
The probabilities of being in an uptrend, after a bullish Candlestick signal, are extremely good. The uptrend may last for a day or two; it may last for three weeks. The signal itself cannot convey this information.
O.K., you
have the position on. You are in it to maximize your profits with minimal risk.
We all want to see a huge rally once we put the position in place. But reality
tells us that hitting the right stock at the right time in the right market
conditions is a very long shot. Multitudes of events are going to happen that
will make us question whether to stay in or get out of a position. Fortunately,
the candlestick formations provide a simplistic visual depiction of what is
going on in the minds of participating investors.
The
probabilities of being in an uptrend, after a bullish Candlestick signal, are
extremely good. The uptrend may last for a day or two; it may last for three
weeks. The signal itself cannot convey this information. As illustrated from some
of the examples, there are signals that will show more potential than others.
The Gap and Kicker signals are likely to foretell a strong rally.
The uptrend
is assumed, but many factors can terminate a rally. Market conditions, news
events, rumors, many outside influences can affect stocks upward move. Profit-taking is another common pullback factor. Having knowledge of the common
“sell” signal formations improve the exit strategy. Combining the knowledge of
“sell” signal recognition with stochastics helps the Candlestick investor
distinguish between sellers stopping an uptrend, or whether profit taking is
occurring. There are a number of continuation patterns that reveal profit-taking
versus reversal patterns.
The same
logic should be incorporated in the exit strategies as in entry strategies. The
bottom-line thinking should be, “have the sellers
taken over?” This can be easily analyzed by evaluating the
buying that got the price to the current level and the condition of the
stochastics. Numeric formulas do not work for Candlestick formations. The buys
and sells are based upon a change in investor sentiment. If the last candle
represents buying, the trend should continue until the sellers demonstrate that
they have overpowered the buying. A sell signal or a weak price move will
demonstrate the buyers are exiting the trade.
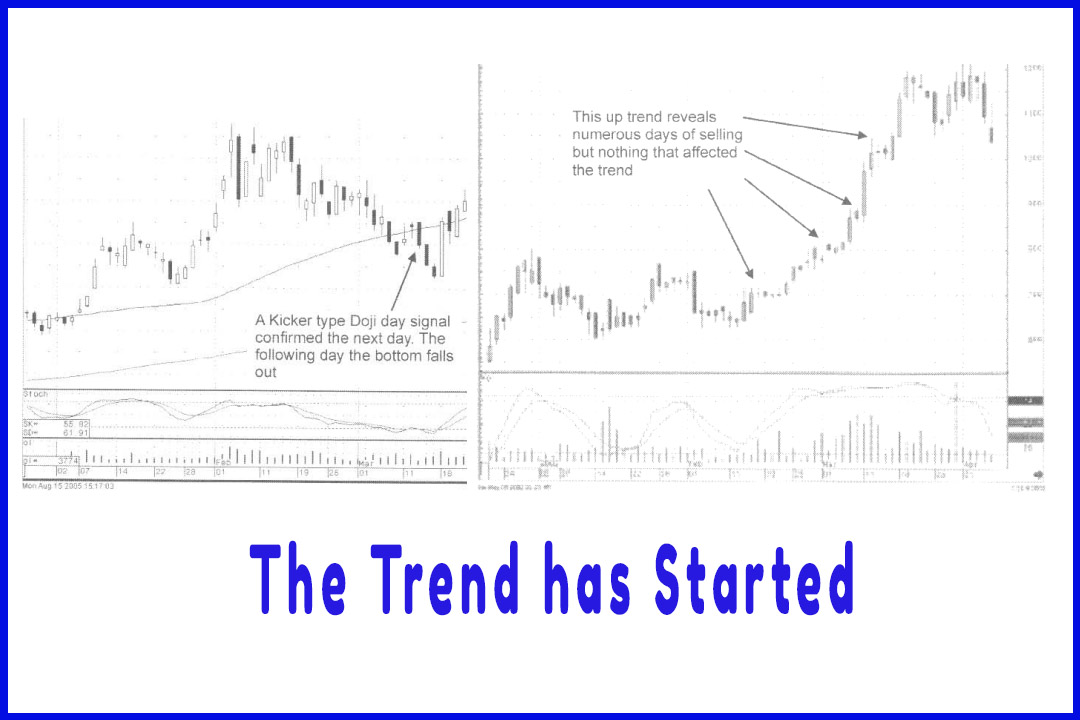
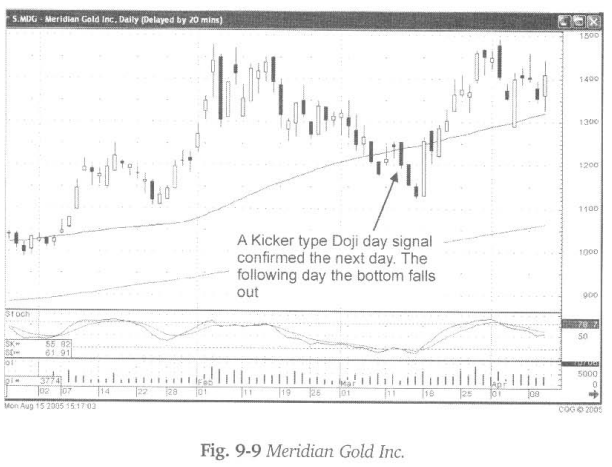
Note in
Fig. 9-9, Meridian Gold Inc. had strong buy signals a few days before the
actual major run-up. A gap up (Kicker Signal) formed followed by another day of
buying. Nothing in this chart would have indicated the next three down days.
How do you protect yourself from this event? Each evening, analyze each position. What
would the price action have to do the next day to reveal that the sellers had
taken over, more than just some profit taking? In the Meridian Gold price
movement, it would have been logical that if the price closed below the halfway
point of the previous day’s trading range, the sellers may have taken over
control.
How does
one protect from this action? When a buy signal is negated by a “sell” signal,
there should be some immediate evaluation as to what the trend is doing. In
this day of inexpensive commissions, if the situation is causing some doubt as
to the direction of a trade, get out. With Candlestick signals providing more
excellent picks every day than what any investor could utilize, why stay in a
position that is casting doubts? Liquidate the trade and go on to a high
probability trade.
As
mentioned in “Profitable Candlestick Trading” there will be a common price
action described as a “scary” day. A scary day usually occurs about two, three,
or four days into a new trend. After moving up for a few days, the sellers or
profit takers knock the price of the stock down hard early in the day. However,
by the end of the day, some of the sell-off is recovered. It creates an evening
of great investment decision turmoil. Was this day just a last gasp sell-off or
was there some new dynamic that was changing the trend direction? If the
stochastics, as well as the other indicators, appear to be acting strong, let
the price play out the next day. Stocks do not go straight up; expect a trend
to have some pullback days.
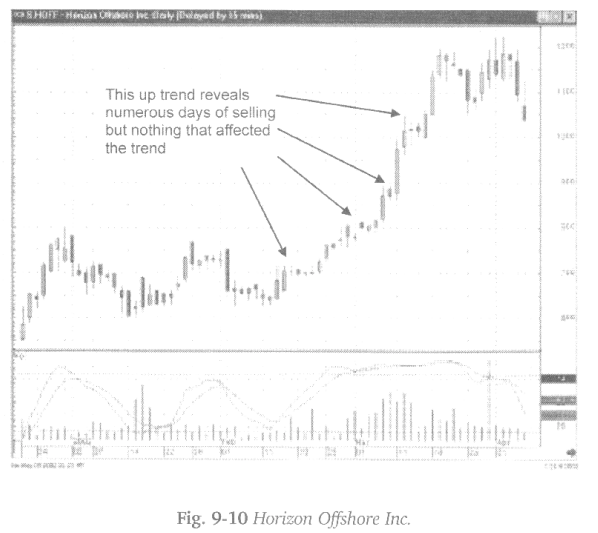
The
ultimate up trend is a majority of white-bodied candles with an occasional
dark body candle created by profit taking. Note in fig. 9-10, tire up-trend of
Horizon Offshore Inc. the appearance of dark candles. Though scattered through
the uptrend, they never formed a “sell” signal, just periodic profit-taking
days.
Exiting a
trade uses the same simple premise that the buying side of the trade uses. Are
the buyers still present? It is not uncommon to witness a double bottom at the
bottom of an extended downtrend. It represents the buyers coming into a stock,
moving it up, and then the last of the sellers come back. This moves the price
back down to, or close to, the recent lows. This formation is observed after a
few days of up move; the trend experiences some small sell signals and moves
back down to the recent lows. Recognizing the small sell signals may take some
time to get accustomed to, but it is easy to review the price action at the
beginning of trends by looking through past charts. Find up trends. Examine
what price actions occurred. This will accomplish two functions.
If you
are still learning the signals, it will reinforce the recognition of signals at
the turns. The next tiring investors want to become familiar with is what
formations appear in strong up moves versus what formations appear in rallies
that fizzle out quickly. The visual advantage of the Candlesticks is the
definite contrast created by the dark and light candle bodies. As can be imagined,
the more dark bodies seen in a trend, the tougher that trend is having to move to the upside. The earlier you witness dark bodies, the greater the probability
the trend is experiencing new selling.
Studying
the previous trading in this chart provides the insight that a trend will
continue because no definable Candlestick “sell” signal appeared. There were
some potentially doubtful moments, but the uptrend was completed because the
selling candles showed consolidation versus an outright reversal, no major change
in investor sentiment.
Simple Rules
Being
that the Candlestick signals are formed by price moves, and not by any numeric
quotas, percentage stop points cannot be applied. The basis for stop losses in
Candlestick analysis is simple. If a signal is created by the evidence of
buying, then a complete retracement of that signal reveals that the sellers
have undone what the buying did. Simply stated, if the confirmation of one of
the Candlestick formations was a price move from $10.50 to $11.25, then it
would be assumed if the sellers push that price back down through $10.50 they
were back in control. In other words, the price coming back down through the beginning
of a buy signal negates the signal.
Once an
uptrend starts, if an opening price appears more than one-halfway down the
previous white body, be ready to liquidate immediately. This implies that
something changed during the non-market hours. Be prepared to sell if prices
appear to want to trade lower, especially if there is bad news reported
overnight. When a stock price gap down dramatically, profitable strategies
can be implemented based on the trend, prior to the announcement.
Some
charts will reveal a day that shows strong buying followed the next day with
some selling. Expect this as a new trend is developing. However, if Day 3
shows buying, then Day 4 shows selling, there is reason to be concerned. The
sellers are not stepping out of the way. The strong buying is not evident. Take
a tiny profit and find another trade with more upside potential.
When in
doubt, get out. There is no economic reason to not get out of a trade if it
shows weak indications after you have just bought it on a strong buy signal.
First, there are many more trades to be found. Second, there is no rule to say
that if a position looks doubtful, get out and watch for the next buy signal.
Not all stocks go up on a “buy” signal. The majority do! It is sometimes
prudent to get out of a position and then come back in later when the signals
demonstrate a more bullish situation. The point is not to make the most money
from each trade; the purpose of successful investing is to make the most with
the dollars available.
How To make High Profit In Candlestick Patterns : Chapter 8. Candlestick Entry and Exit Strategies : Tag: Candlestick Pattern Trading, Option Trading : Single candlestick patterns, Types of candlesticks, Powerful candlestick patterns, Types of candlesticks, Candlestick chart analysis, Bearish candlestick patterns - When is it Time to Get Out?