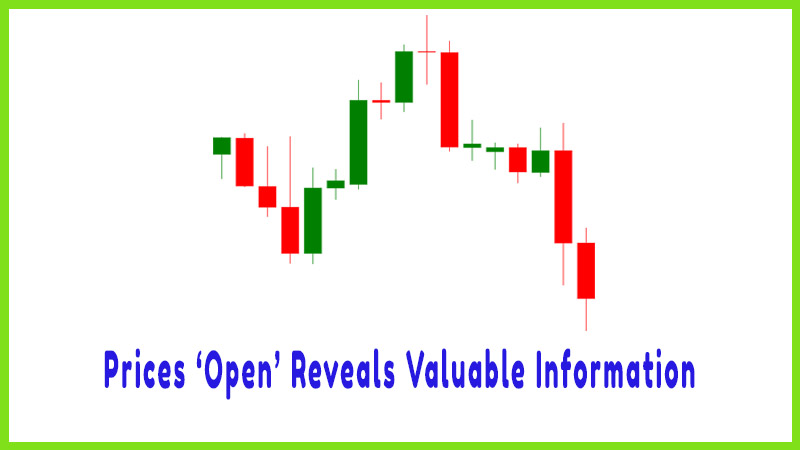
Prices ‘Open’ Reveals Valuable Information
Candlestick trader, Continuation patterns, psychology in downward trend, Candlestick signal, candlestick reversal signal
Course: [ How To make High Profit In Candlestick Patterns : Chapter 8. Candlestick Entry and Exit Strategies ]
Simply stated, the signal is showing the evidence of buyers coming into a stock, reversing the previous downtrend. The Candlestick trader can identify those signals, 12 major signals and approximately 50 secondary signals and continuation patterns.
How Prices ‘Open’ Reveals Valuable Information
After the
above wordy dissertation, the meat of this subject is being aware of how to get
into trades properly. What is the message of a “buy” signal? As expressed in
the Profitable Candlestick Trading book, a signal is the cumulative
knowledge of all investors participating in that stock that day. If this is
the only statement that you remember about Candlestick analysis, you will
easily comprehend the ramifications behind the signals. A “buy” signal forms
by the reversal of investor psychology in downward trend. That formation
becomes visually evident to the Candlestick investor.
Simply
stated, the signal is showing the evidence of buyers coming into a stock,
reversing the previous downtrend. The Candlestick trader can identify those
signals, 12 major signals and approximately 50 secondary signals and continuation
patterns. As discussed earlier, the signals each provide a positive percentage
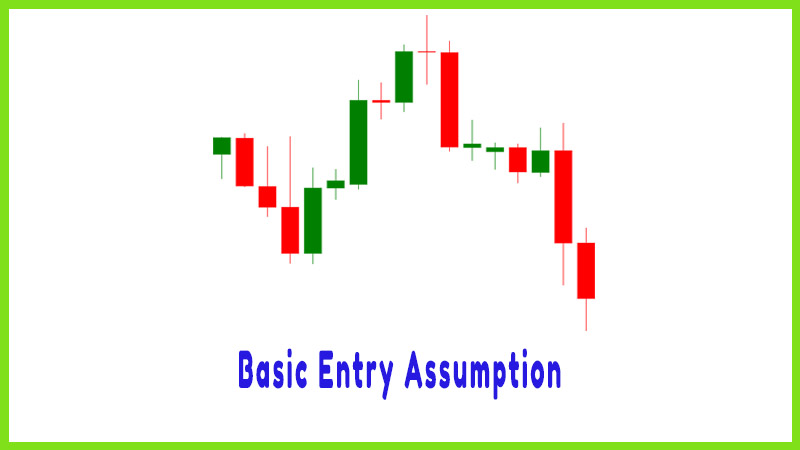
of profitable trades. Upon recognizing a candlestick reversal signal, the best
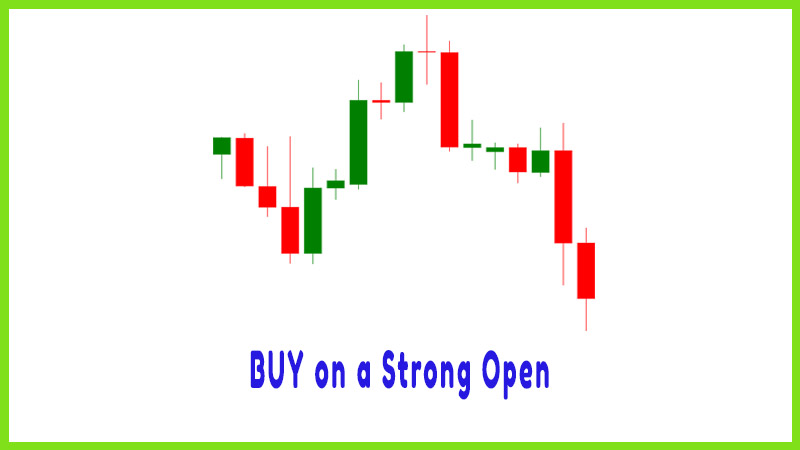
test to determine when to establish your position is based upon one simple
question. “On the open of the next day, are the buyers still showing their
presence?” This may appear to be elementary, but that is the basis for getting
into the position in the first place. The Candlestick signal represents a change
of direction. The magnitude of buyers present is an important factor on how
strong the reversal will perform.
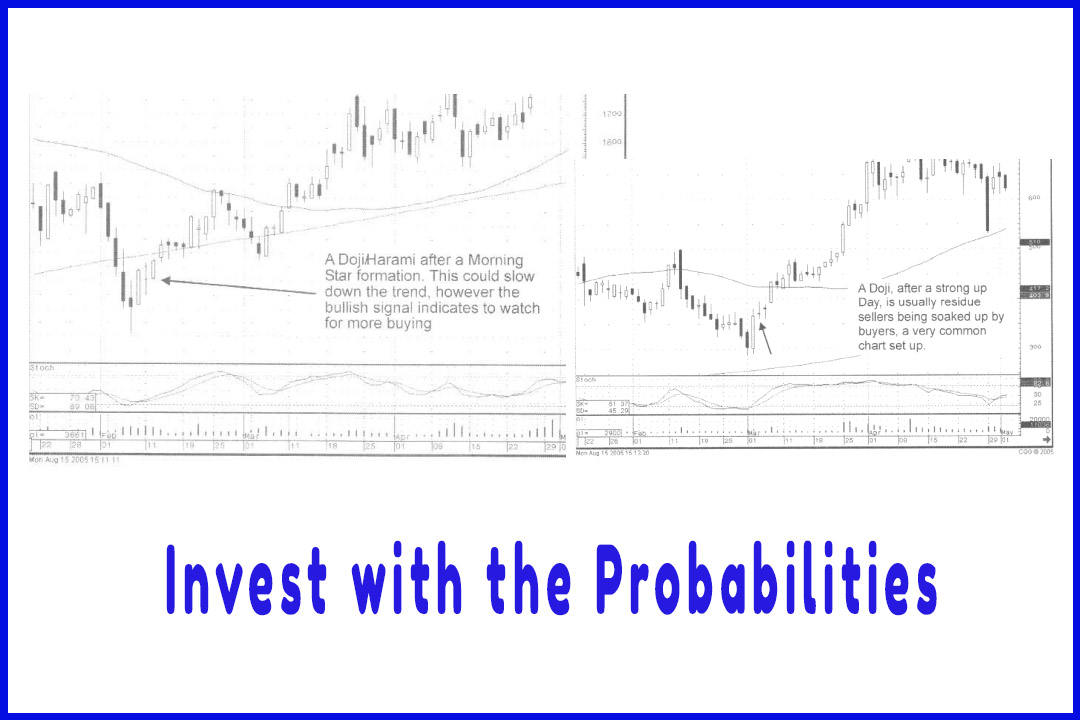
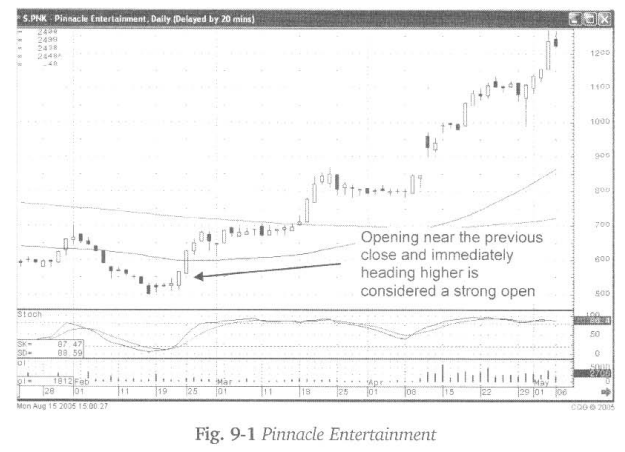
Fig. 9-1,
the Pinnacle Entertainment chart opens near the previous close. This clearly
indicates that the buyers have not backed away. Witnessing the price advance at
the ‘open’ reveals that buyers are stepping in without hesitation. Buy immediately.
You have all the parameters evaluated. The probabilities are in your favor.
There should be no reason not to get into the position.
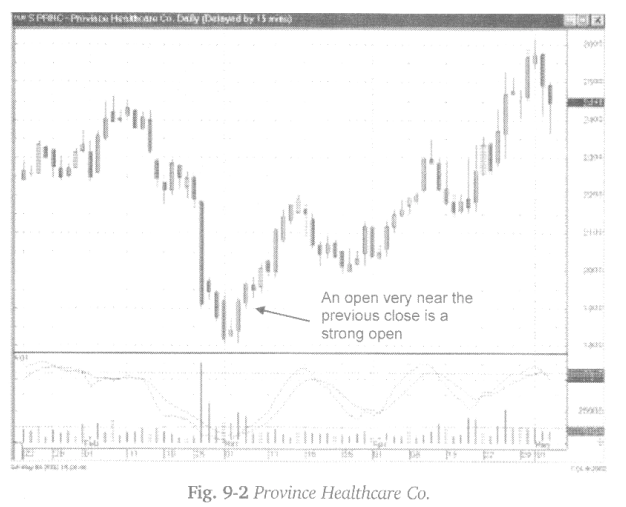
Note in
Fig. 9-2 Province Healthcare Co. that the buyers were still present. The open,
by remaining in the area of where the buyers closed the price the night before,
indicates that there was not a change of heart during the evening. “In the
area” can mean a slightly lower opening price. Consider the action of the
price the previous day. It had a big up day. As the end of the trading day is
getting near, the shorts may have realized that buying was the overriding influence.
The shorts may have covered, pushing the price up further on the close. Profit
taking or sellers still wanting to get out of the stock could lower the price
on the open. The next morning, prices opening slightly lower and immediately
moving higher indicate that the buyers have not disappeared. As soon as the
first few minutes of trading transpire after the open, an investor should be
able to ascertain how the stock and markets arc performing.
If the
market in general is not falling out of bed and the stock price does not appear
to want to move lower, it is time to start establishing the position. A prudent
method would be to buy half the position at the slightly lower level and put a
buy stop at the previous days close for the other half. The rationale being
that if the price conies up through yesterday’s price, the buyers are still
present.
The most
promising form of evidence, indicating the price is getting strong buyers’
attention, is the gap up. Note in Figure 9-3, Meritagc Corp,, a gap up formed.
As defined by the gap, the strength of the buyers is very strong. A gap- up, at
the bottom of a downtrend, and after a candlestick reversal signal, is one of
the best signs of buying strength. One should be committing funds immediately.
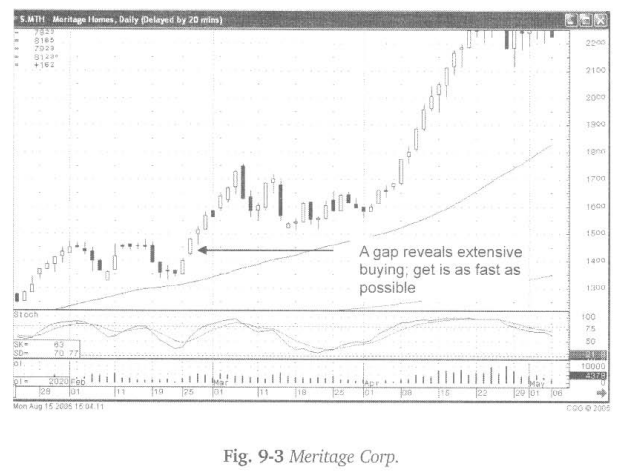
The gap
up at a beginning of a trend bodes very well for an extended rally. Whether the
indexes are opening up weak or strong, a gap up in a stock deserves immediate
attention. The buying coming into this stock is not concerned about the status
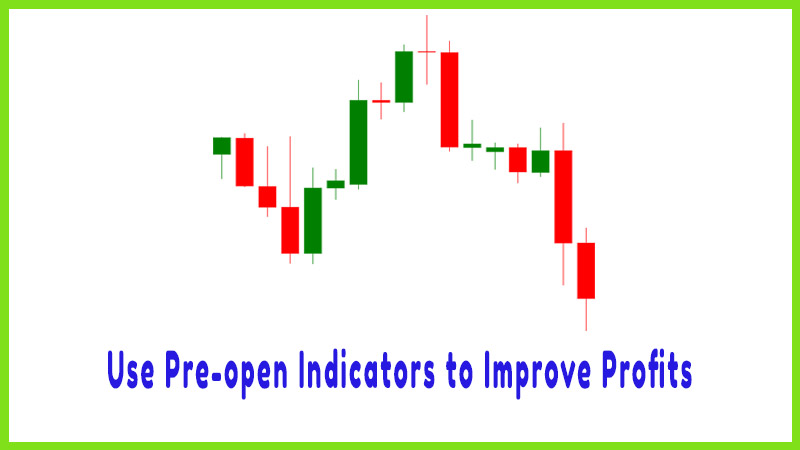
of the markets. Try to get into tire stock as fast as possible. The advantage
of being able to view the bid and ask prior to the open is that it prepares an
investor for an entry strategy. Seeing a stock price biding up before the open
and knowing what a gap up indicates after a Candlestick signal allows for
placing a market order on the open.
Use that
buying force to your advantage. Get in early as possible. Again, the
probabilities are in your favor and this time the gap is adding to the force of
the move.
Sometimes
you are going to see a gap up; you get in and then watch the price head back
the other way. Don’t worry. The buy signal was the reason to buy. The buyers
were still around if prices gap up. If profit taking occurs after that, no big
deal, the buyers are still around. Wait for a day or two and the signal should
confirm itself.
A
substantial gap up may require watching to see if there is any immediate profit
taking. This might be better accumulated by buying one-half the position on the
open, the second half after observing the price move. In some substantial gaps
up, the opening price might be the high for that day, creating a black candle.
The fact that it had many buyers on the open, followed by some immediate profit
taking, still reveals that there was a strong change in sentiment.
“I hear and I forget. I see and I remember. I do and I
understand.”
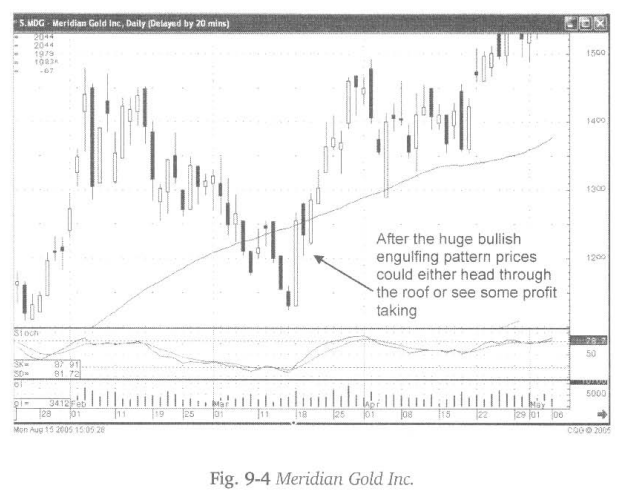
Note in
Fig. 9-4, the Meridian Gold Inc. chart, how the large bullish engulfing pattern
clearly illustrated that the bulls had stepped in. This shows a great buying
influence. The next day gaps up. This could be the beginning of a very strong
rally. This has all the makings of a strong run up. There would be no reason
not to get into the position. However, once the position is filled, the profit
taking sets in. Is this time to worry? Remember what the bullish engulfing
pattern told you. The buyers were coming into this stock with great force for
some reason. It would seem very unusual that the next day they would all of a
sudden disappear.
It is not
unusual to see some profit taking after a 10% to 15% run up in two days. The
underlying factor remains that the buyers have come into this position with
vigor. Sit comfortably for a day or two to see what happens after the profit
taking disappears. In this case, the strong ‘buy5 signal was the prelude to
more buying.
The
appearance of a gap tip is a clear indication that the “buy” signal is having
the follow through that is required to sustain a strong rally.
Fig. 9-5,
The Exploration Co. has every sign of strong buying. A Bullish Engulfing
pattern is the first signal. The gap up and the strong buying afterwards is
more evidence. There would be no reason for not getting into the position on
the next show of strength.
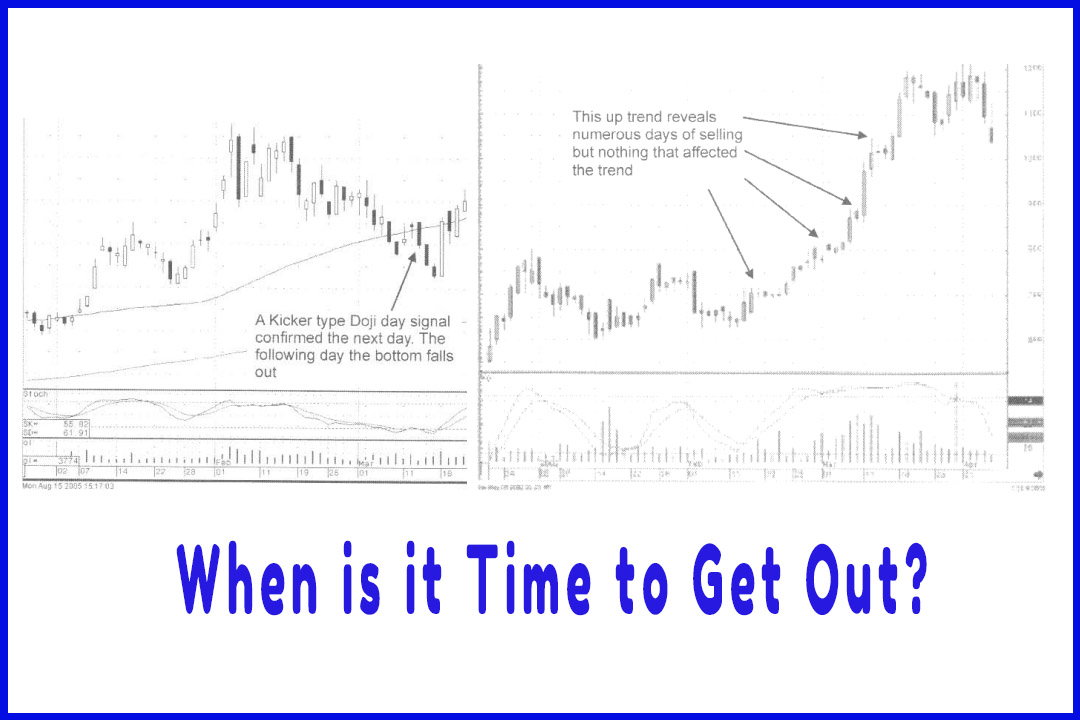
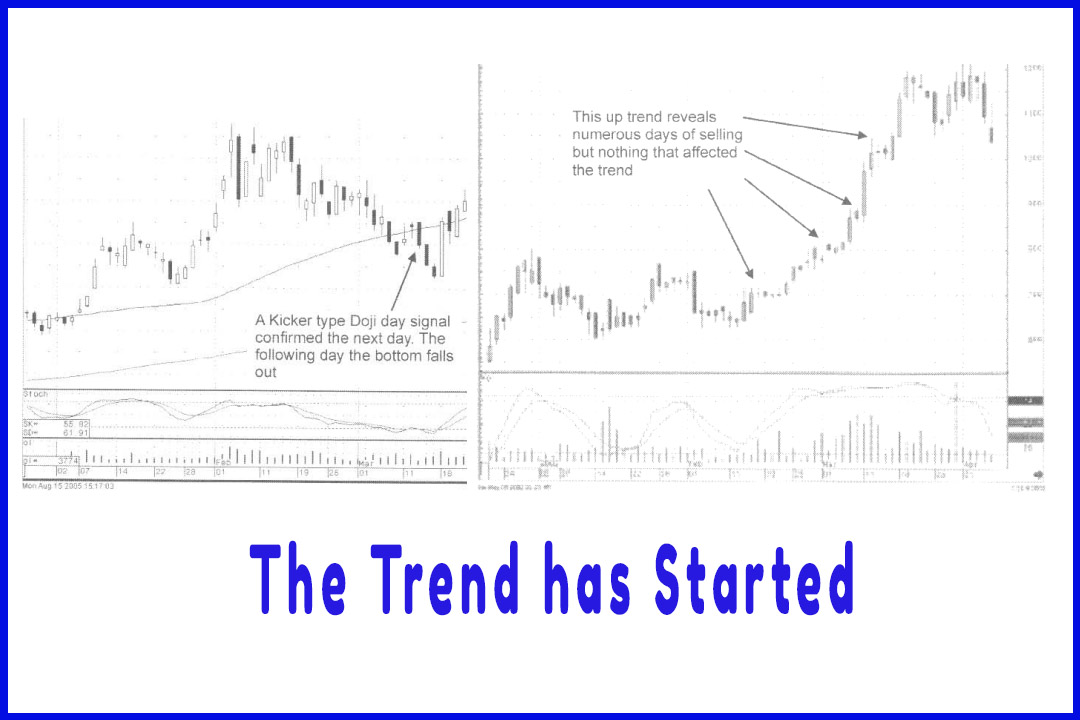
Once you
have gotten into the position, the price rolls back. Profit taking, or the market
in general starts getting weak. Your peace of mind is still in the strong buy
signals. As in this illustration, it took a few days for the trend to start
back up. During those few days, note that the sellers could not knock the
prices down.
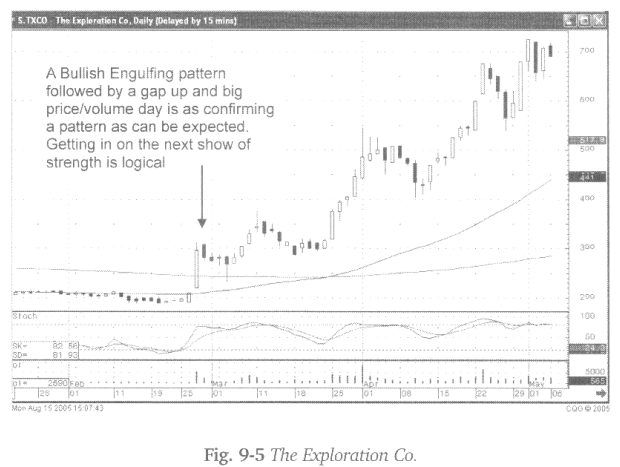
It may
have tested some nerves, but after 3 or 4 days, the bulls starting gaining
confidence that the sellers did not have enough strength to push the price back
down. This leads to the continuation of the upward trend. It took a few extra
days but that is reality. Some positions look great when you get in but will be
a laggard for a few days. Nevertheless, if the message of the signals is
correct, the trend will be continuing. Sometimes that will take patience but
the probabilities will be in your favor.
How To make High Profit In Candlestick Patterns : Chapter 8. Candlestick Entry and Exit Strategies : Tag: Candlestick Pattern Trading, Option Trading : Candlestick trader, Continuation patterns, psychology in downward trend, Candlestick signal, candlestick reversal signal - Prices ‘Open’ Reveals Valuable Information