Importance of Volume
Doji patterns, Volume for confirming candlesticks, Candlestick pattern, Reversal pattern
Course: [ Uses of Candlestick Charts : Chapter 3. Single Reversal Patterns ]
Volume is, quite simply, the amount of trade going through at each price or each period of time. If volume is light you can assume that the price action you’re seeing may not be the real deal.
The importance of volume for confirming candlesticks and why candlesticks work whatever the market, whatever the time frame
Looking
at these Doji patterns is a good time to introduce an important aspect of any
reading of candlestick charts: volume.
What does "Volume" mean?
Volume
is, quite simply, the amount of trade going through at each price or each
period of time. If volume is light you can assume that the price action you’re seeing
may not be the real deal.
If you
see a move on strong volume you can be assured that the move is the result of
strong buying or selling, and therefore there’s some sustainability to the move
in question. Quite simply, accompanying volume is one of the best ways to
confirm any candlestick pattern, but if you see a reversal pattern (or a major
price move) on very weak volume you should treat it as suspect.
Volume is
illustrated on a candlestick chart in a separate box below the main body of the
chart, usually expressed as a histogram. There have been attempts to
incorporate volume into the candlesticks themselves. One example is an
Equivolume candle chart, where the width of the real body varies depending on
whether it was accompanied by strong or weak volume. The fatter the body the
more volume was seen. I’ve never been that much of a fan, but that’s possibly
because I started off with bar charts, and I got used to having volume down at
the bottom below the prices.
Coming
from a trading floor background I always felt that volume was a great word to
describe trading activity. If you were in the coffee lounge behind the LIFFE
Floor, you could hear a change in noise level from the market, and even if you
didn’t you soon heard the noise of feet running back to the floor because
something had happened to cause a sudden leap in activity.
Even
today in a dealing room at one of the large banks or brokers you can tell
almost instantly whether a market is quiet or busy. I think this is where a lot
of remote traders miss out when they sit and trade from home. They can try to
re-create this by using the business news channels or a Squawk service for
“ambient” noise, but the best tool the chartist has for tracking activity is
the volume histogram.
A jump in
volume means something’s happening. A candlestick pattern that’s got
(relatively) large volume accompanying it generally makes for a stronger
signal.
Example
Let’s go
back to our old favourite chart from the end of the last section to illustrate
this point:
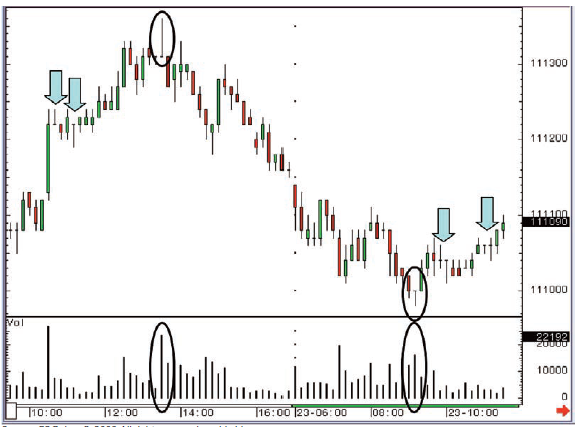
Figure 3-23: Eurex Bobl futures;
10-minute candlestick chart; 22 & 23 April 2003
You can
see that both the candlesticks I highlighted, the Gravestone Doji and the
Dragonfly Doji, were particularly strong in the volume department. I have also
highlighted a few other Doji candlesticks on this chart (with the blue down
arrows), but as you can see if you look down to the volume histogram, there was
no significant accompanying activity; this suggests that these Doji were
probably the result of indifference rather than a big two way swing between
buyers and sellers that could have trend changing significance.
Note regarding Doji on short-term charts
I
purposely chose Doji to illustrate the point about volume, because when markets
get quiet you get a lot of Doji. This is quite simply because volatility is
very low, and therefore the chances of opening and closing at the same levels
increases.
I spend a
lot of time looking at short time frame charts, but find that candlesticks work
well whatever the time frame, something that this chart once again illustrates
very well.
The Doji
candles that were formed on light volume were merely the result of the market
going sideways; marking time because no one was actually around to trade. They
appear over lunchtime when the morning rush is done and the market is waiting
for the US session to get underway. They’re often the result of half the market
going out to buy a sandwich, rather than any major reversal in thinking about
the market.
A closer look at our Dragonfly Doji example
If you
took a look at our Dragonfly Doji in Figure 3-23 without the assistance of the
volume histogram you’d surely class it as a similar deal, based on it being
such a tight range. In this 10-minute period only three different prices were
traded, 111.00, 110.99 and 110.98. The market opened and closed at 111.00,
hence there is no real body, just a line at the top of the candle. If we add
the volume into the equation we suddenly realise that this 10-minute period
with an extremely tight range was actually one of the busiest 10-minute periods
over the whole day. Neither the bulls nor the bears appeared to have achieved
much, but they certainly had a good old go at each other, and because the
market was on the day’s lows, and had sold off 38 ticks from the high of the
previous afternoon, the bulls can be rightfully happy with their work. In fact
you could almost argue that there was someone out there who wasn’t prepared to
see the market drop below the psychologically important 111.00 mark, and spent
that entire 10-minute period hoovering up the sell orders and making sure the
market was always bid over, so that the sellers eventually realised they’d hit
a brick wall.
Psychology
Generally
if you hit a brick wall there’s only one way to go, and it’s no exception in
the markets. The sellers walked away after our high volume tiddler of a
Dragonfly Doji, but it was only the volume that highlighted how significant
this candlestick actually was. Without the volume we wouldn’t have realised the
significance of this Doji.
More on the subject of short-term trading
A
question I often get asked is whether candlesticks work well in time frames
other than the daily chart, particularly for short-term traders. My answer is a
categorical “Yes.” In my daily analysis I view 10-minute, 60-minute and daily
candlestick charts all the time, and during the course of a day constantly spot
reversal patterns on the 10-minute chart. The nice thing about this is the
instant gratification that they can provide. While on a daily chart you have to
wait 2 days to see a Hammer and a green candle to confirm it, on a 10- minute
chart this would only take 20 minutes. The message is exactly the same: the
Hammer is a period of time where the market sells off then rallies to retake
the earlier losses. The green candle adds its weight to the argument for a
reversal. It doesn’t matter whether this combination of movements takes two
days or 20 minutes, the market still need to do exactly that to get those two
candles. I will spend a bit more time on these ideas later on (see pages
125-126).
With
these patterns you should always look for confirming volume, which proves that
a battle has indeed taken place at this time.
In fact on short-term time frames candlesticks like Shooting Stars and Hammers make even more sense. If you’ve ever spent any amount of time looking at a day session unfolding you’ll see times when stops are triggered and the market heads quickly off in one direction, especially when an old support or resistance level is breached, only for the move to suddenly reverse. To use a Hammer as an example, the big traders look for places where small, weaker traders have their sell stops, and they trigger these stops, then flip their direction and start buying the market, taking it back through the old support level as quickly as the stops had seen us drop below there. This sort of price behaviour generally leaves a long lower shadow on the short-term charts, or a Hammer to you or me.
Chapter
summary
Having read this chapter you should now
be aware of those key candlestick patterns that are constructed of just one
candlestick.
The Hammer and Shooting Star are strong reversal patterns whatever the time frame viewed.
The Hanging Man and the Inverted Hammer may be similar in shape to the Hammer and the Shooting Star, but they’re seen in different trends, and as such their impact is usually greatly reduced.
Doji are powerful reversal patterns in downtrends and uptrends, and are very easy to spot due to the lack of real body.
Volume is another important element to consider when viewing candlestick charts.
We will now move on to reversal patterns that are constructed using more than one candlestick.
Uses of Candlestick Charts : Chapter 3. Single Reversal Patterns : Tag: Candlestick Trading, Forex : Doji patterns, Volume for confirming candlesticks, Candlestick pattern, Reversal pattern - Importance of Volume