Integrate Pivot Points
scale out of positions, pivot points, pivot resistance, pivot point target levels
Course: [ The Candlestick and Pivot Point Trading Triggers : Chapter 10. Projecting Entry and Exit Points ]
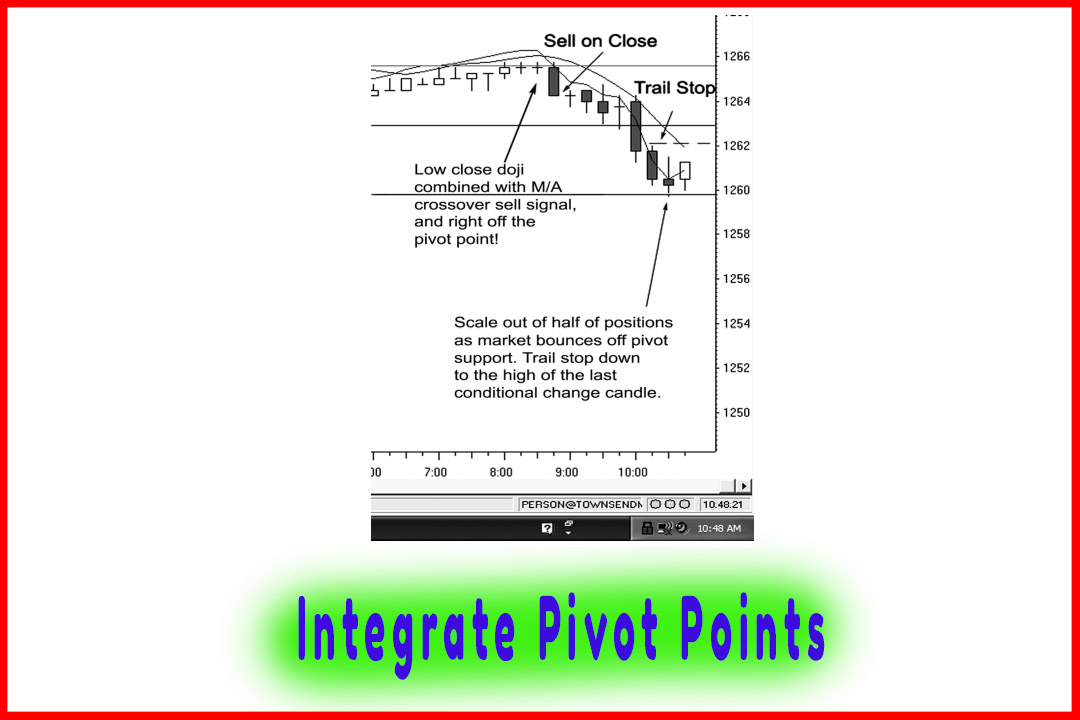
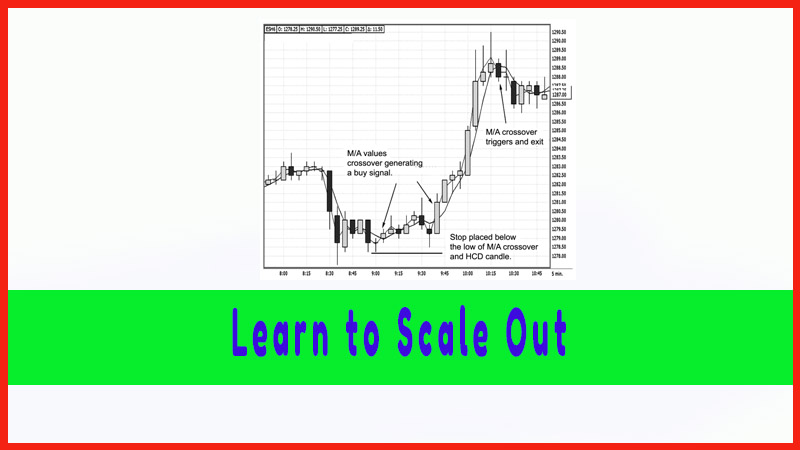
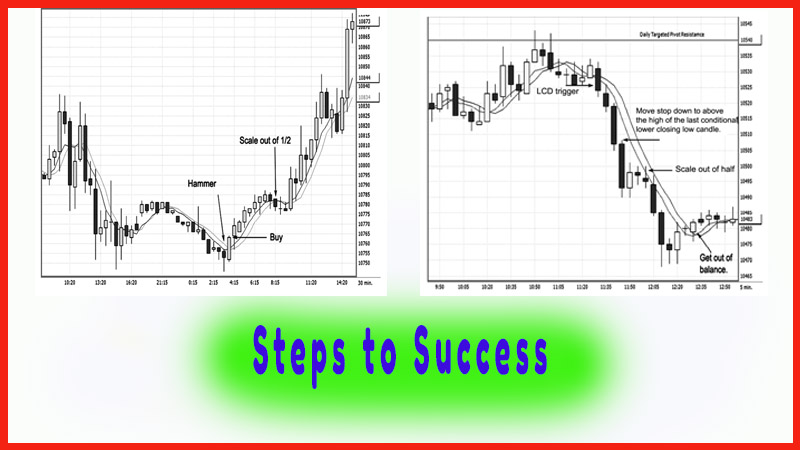
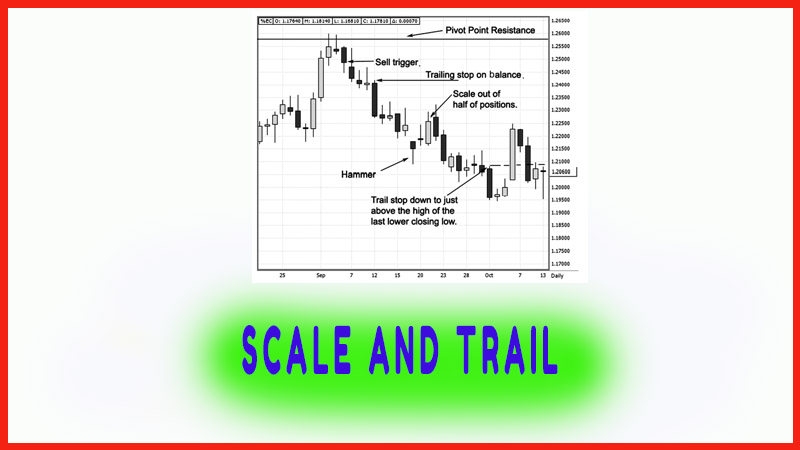
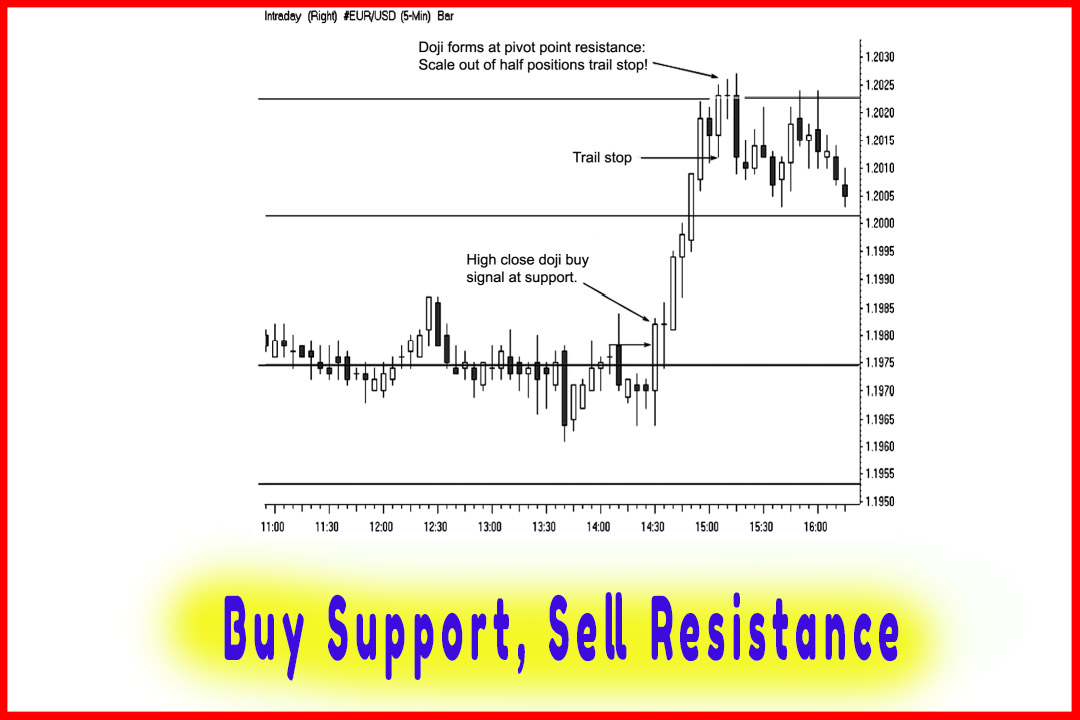
We have gone over how to move the stops and why it is good to scale out of positions. We can integrate pivot points to help us trigger our entries and use the pivot point support or resistance levels to help us target our exits.
INTEGRATE PIVOT POINTS TO HELP TIME OUR EXITS?
We have
gone over how to move the stops and why it is good to scale out of positions.
We can integrate pivot points to help us trigger our entries and use the pivot
point support or resistance levels to help us target our exits. As shown in
Figure 10.4, we have a 15-minute candle chart showing a classic sell signal
with a low close doji at pivot resistance, and we see how the moving averages
have crossed and the market is trading below both values.
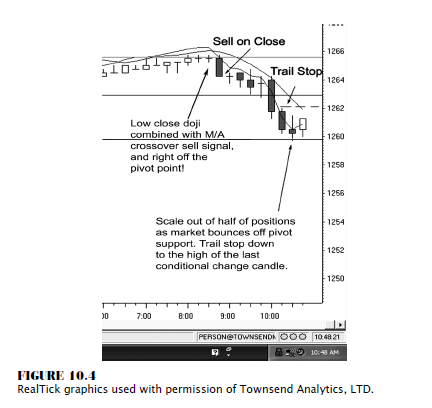
We have a
call to action to sell on the close or on the next open. This chart is the
e-mini-Standard & Poor’s (S&P), and we would be filled at 1264.25. The
market declines in the perfect order—lower highs, lower lows, and lower closing
lows—right until we see the market trade down to the pivot support target. This
is a perfect opportunity to scale out of half of your positions. Remember that
in Chapter 2 we went over the fact that once a market goes into trend mode, it
will then go into a consolidation phase. We do not know if the trend will
continue or reverse; so at this point, it makes sense to trail a stop on the
balance of positions.
I use the
point just above the last conditional change, which is the candle that made the
last lower closing low. We cover half of the positions at 1260.75 for a
3.5-point gain, or $175 per contract. We would lower our stops on the balance
to 1262.25 to lock in profits on the balance of positions. Using the pivot
point target levels will help you identify when and where to scale out of
positions.
The Candlestick and Pivot Point Trading Triggers : Chapter 10. Projecting Entry and Exit Points : Tag: Candlestick Pattern Trading, Forex, Pivot Point : scale out of positions, pivot points, pivot resistance, pivot point target levels - Integrate Pivot Points