Steps to Success
Find successful trade, pivot point trading, best entry trade
Course: [ The Candlestick and Pivot Point Trading Triggers : Chapter 10. Projecting Entry and Exit Points ]
The steps outlined here are a review of the overall purpose of the trading methods discussed in this book. Pivot point analysis helps give me a “heads up” on the potential range of a session.
STEPS TO SUCCESS
The
steps outlined here are a review of the overall purpose of the trading methods
discussed in this book. Pivot point analysis helps give me a “heads up” on the potential range of a session. The moving
average of the pivot point helps give me a truer reflection of the market’s
value, and that helps me define the market’s condition and possibly the correct
direction. Candlestick charts help illustrate and define the trigger, which
enables me to carry out a systematic process of arriving at optimum plans and
strategies for my trades. With that, I am now aware of the full range of issues
to be considered in a systematic thinking process before entering a trade. By
examining a set of relevant questions, such as how low the market can go, what
the next support target is, how high the market can go, and what the next
resistance level is, I can formulate a trading plan with a clear, concise
strategic idea. Exiting the positions and taking money off the table should be
the easy part. However, as it turns out, that is the hardest part for most
traders.
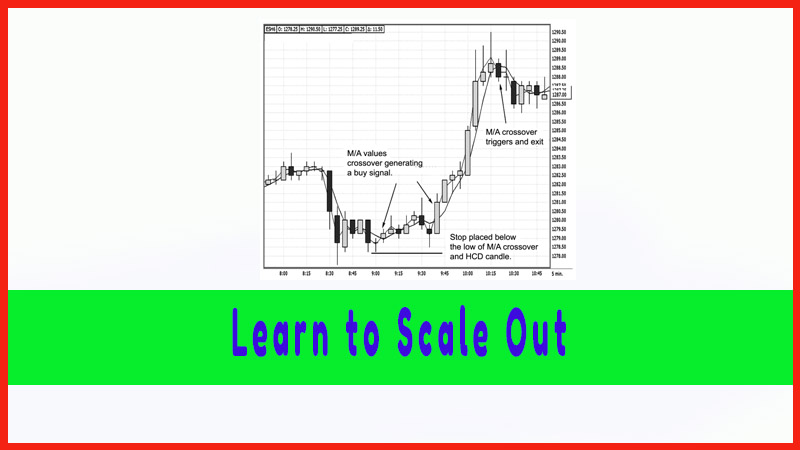
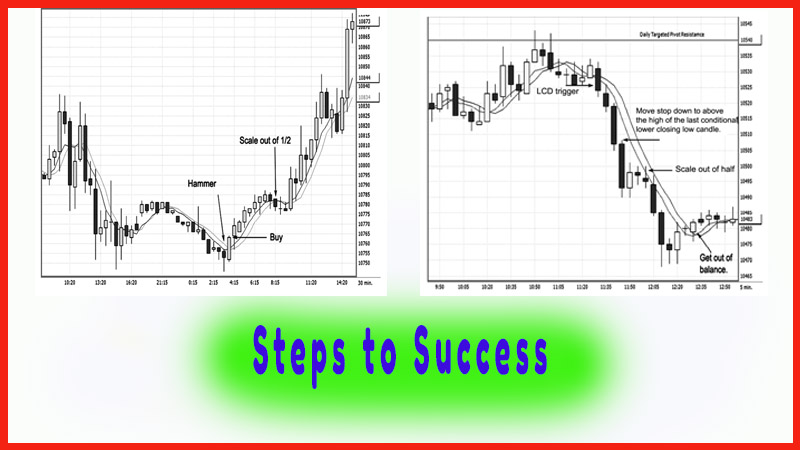
Let’s
take a trade example as shown in Figure 10.1. The hammer forms; I buy on the
close, as the market closed above the moving averages; and I have immediate
results. I entered at 10765; and the bullish momentum carried the market
higher, as indicated by higher highs, higher lows, and higher closing highs.
The market has lost the bullish momentum, as I see a lower- close-than-open
pattern develop on two time periods followed by a doji. That is the definition
of price action demonstrating a loss in bullish momentum. Therefore, that
dictates for me to liquidate half of my position, which is at 10780. Hardly a
profit to speak of, considering the mini-Dow is $5 per point, which is only a
$75 profit. But it is a profit.
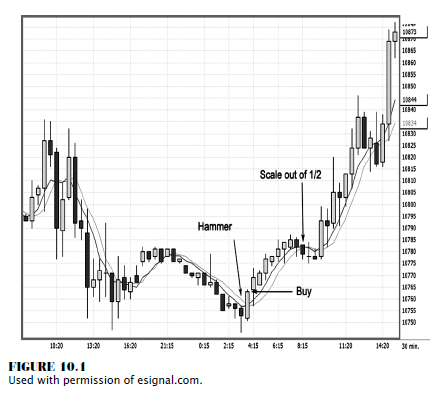
Now what about the balance
of my positions, and where do I place my stops? In this example, I would
suggest either moving stops up to my break-even point or, as just discussed,
placing the stop on a close below the low of the most recent conditional change
candle (a higher closing high), which occurs at the 6:15 time period. At this
point, I do not know if the market will move higher or lower, but I definitely
have a loss of momentum. In this situation, prices established a pause, or consolidation; and then the market did break
out and continued the uptrend. With scaling out of half of the position, I have
a profit and am continuously participating in a tremendous trending condition,
as the market ends up more than 10870. That equates to more than a 110-point
gain, or $550 per contract, on the balance of positions. As a day trader, did I
do wrong in liquidating half of my position? Not if you follow rules. In this
situation, I did not have a classic sell signal, just an indication of a loss
in momentum. Therefore, it was a prudent measure to get paid on partial
positions and let the balance ride. So in this example, there was a reason or a
call to action, but not a signal for a reversal of the long.
Ever
heard of the saying “Character in great and little things means carrying through
what you feel able to do”? Covering
half of your positions when markets signal a loss in momentum is carrying
through what you are able to do. You made money and stayed with the trade.
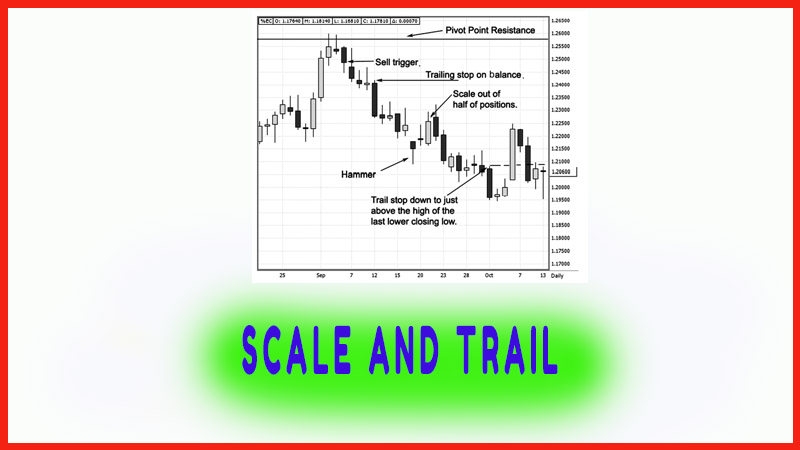
In Figure 10.2, we have a low close doji trigger, a classic crossover of the moving averages, and prices closing below both moving averages. A trigger to sell short was generated at 10523. We see a beautiful event unfold—immediate results with lower highs, lower lows, and lower closing lows—until the 11:50 time period; and the market moves sideways in a consolidation pattern. It does take on the form of a bearish descending triangle; however, we do not know what the outcome will be. As the market is at we are staring at a 30-point mini-Dow move, which translates into a $150 profit per contract. At this time, it is prudent to cover half of the position and put the stop in at breakeven. The market in fact happens to move in the direction of the original trend as the bearish triangle indicated. By following the market flow, we finally see a specific reason to cover the balance of the position with the high close doji signal at 10483. Here we have a 40-point gain on the second half of the trade for a $200 gain. We have, in essence, captured the majority of the trend and kept disciplined in our trading approach while scaling out of half of the position.
DO SOMETHING GREAT
I am sure you have read or heard this expression sometime in your life: “I’d rather attempt to do something great and fail than to attempt to do nothing and succeed.” By scaling out, you have a profit in your trading account while letting the trade mature. You have accomplished a great thing, a true sense of following a business plan—and you made money.
Scaling out of positions is the most appropriate method when the market gives you a clue that the trend momentum is slowing. It allows you to capture a profit while participating in a potential market move. As a day trader, you are not so much concerned with long-term macroeconomic situations as you are with riding a momentum wave. Granted, it helps to have a good understanding of fundamental conditions; but for the most part, you are looking to ride a move and profit from it. That is your job. In short-term trading, conditions change; and you need to capture opportunities as they become present stocks. Foreign exchange (forex) and futures markets are ideal for momentum trades. Traders need assistance with capturing the profits while letting the balance of the position ride or, better stated, with an execution plan. The foreign currency markets also tend to trend well over the course of 7 to 10 days, allowing swing traders opportunities to capture larger price swings over a given period of time. One of the greatest benefits here is that you have access to the markets on a 24-hour basis, unlike the equity markets.
The Candlestick and Pivot Point Trading Triggers : Chapter 10. Projecting Entry and Exit Points : Tag: Candlestick Pattern Trading, Forex, Pivot Point : Find successful trade, pivot point trading, best entry trade - Steps to Success