Buy Support, Sell Resistance
Support and Resistance Cheatsheet, Identifying Support & Resistance Levels, point support levels
Course: [ The Candlestick and Pivot Point Trading Triggers : Chapter 10. Projecting Entry and Exit Points ]
This also falls along the lines of not knowing the outcome of the trading signal and market trend conditions, which can and do change.
BUY SUPPORT, SELL RESISTANCE
Throughout
this book, I have made many references to why I look for buy signals at the
predetermined pivot point support levels and take sell signals at predetermined
resistance levels. This also falls along the lines of not knowing the outcome
of the trading signal and market trend conditions, which can and do change. As
a day trader looking to capture a portion of a day’s potential trading range,
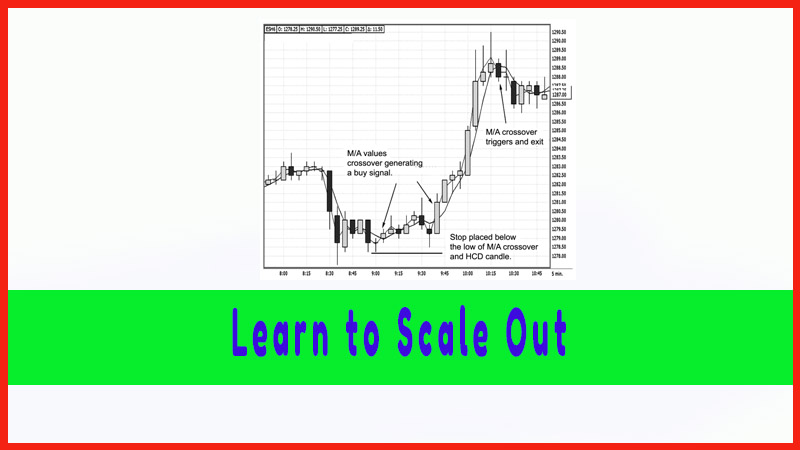
you have to use a plan. Scaling out of positions is such a plan of action. Take
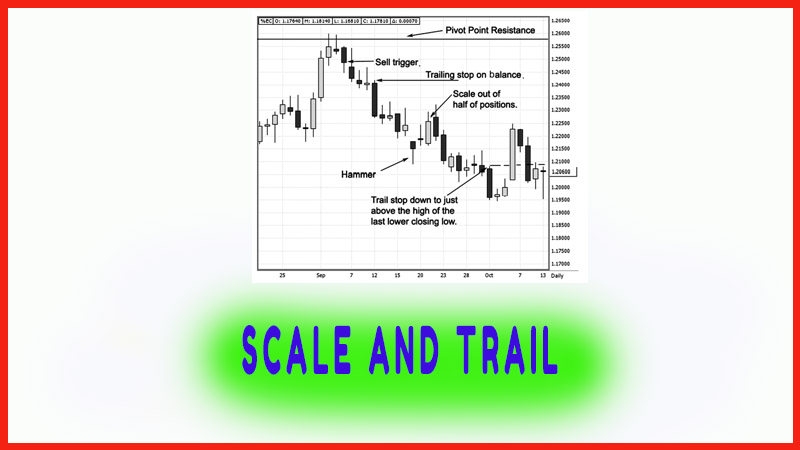
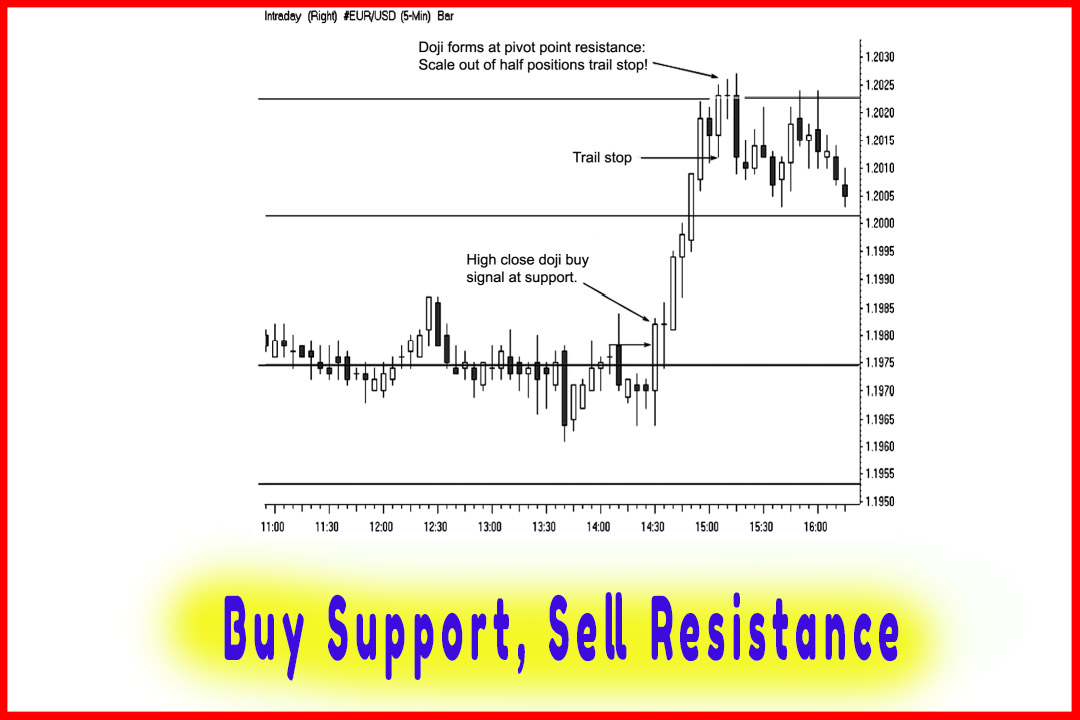
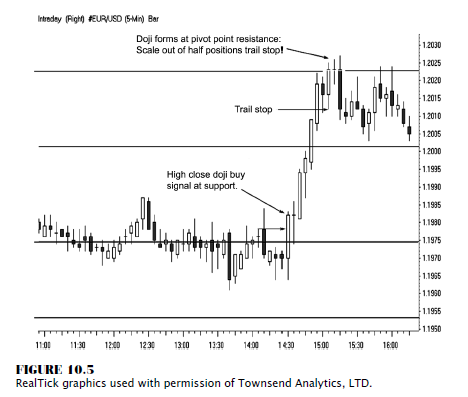
a look at Figure 10.5. We have a spot forex euro currency versus the U.S.
dollar. Notice that the market breaks below the targeted pivot point support
several times; however, prices do not seem to decline very far or carry any
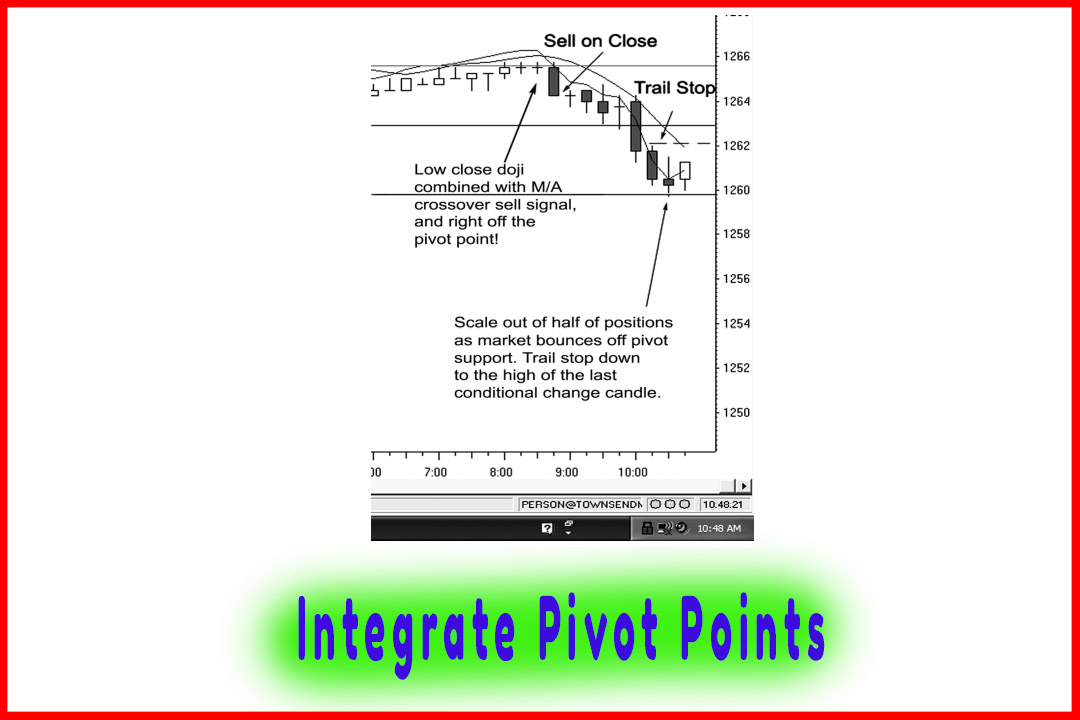
momentum. In fact, a low close doji pattern develops, which means, if you
follow my rules, you do not take sell signals at support. This helps filter out
the false trading signals. Once we have a high close doji trigger to go long at
119.83, we now can place our stop and follow the developments as the trade
matures. We see higher highs, higher lows, and higher closing highs. The market
closes closer to the highs of each successive candle, and the closes of each
candle are above the opens. These are all very bullish signs, and the market
blasts beyond the first resistance (R-1) point. So far, we do not have a reason
to liquidate the position or scale out of the trade. Then as the market trades
at the R-2 level, we see a doji form; and that will be the clue to scale out of
half of the position near 120.20. At this point, we trail our stop on the balance
of positions to the low of the last conditional change candle, which is the one
that made the last higher closing high. We do get knocked out of the trade, as
the market develops into a consolidation phase.
This
trade resulted in capturing a nice chunk of the middle of a beautiful intraday
trending market condition. Scaling out of the first half of the position would
have generated a 40-point profit, or $400 per $100,000 contract lot value; and
the balance would have made nearly 30 points, or $300. There was little to no
pressure once the trade was initiated. Pivot points helped you target the entry
and scale out of the exit. As an interesting note, remember the statistic that
stated that dojis form close to the highs and/or pivot point resistance levels.
Figure 10.5 is just another chart to help visually validate that claim.
Most
people use scale trading as a means to stagger positions to enter as well as
exit a market. There are many variations and specific techniques. It can be
argued that rather than scaling out of half of the positions, you should
actually add on to trades to really pyramid profits. I personally do not use
this style of trading. I encourage you to explore any and all methods, but I
like to stick to the methods that work for me. When I have a projected entry
price based on pivot point analysis, I never have a “guaranteed” profit until I liquidate the trade. By scaling
out, it is the finest method I know of that puts cash in my account while
allowing me to further participate in gains on the balance of positions.
The Candlestick and Pivot Point Trading Triggers : Chapter 10. Projecting Entry and Exit Points : Tag: Candlestick Pattern Trading, Forex, Pivot Point : Support and Resistance Cheatsheet, Identifying Support & Resistance Levels, point support levels - Buy Support, Sell Resistance