Moving Average Convergence/Divergence (Macd)
macd on chart indicator, macd signal, macd full form, macd indicator how to use, macd settings
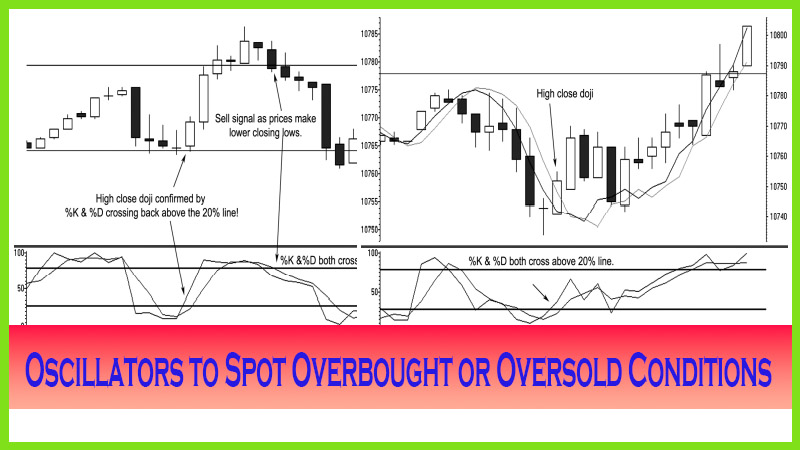
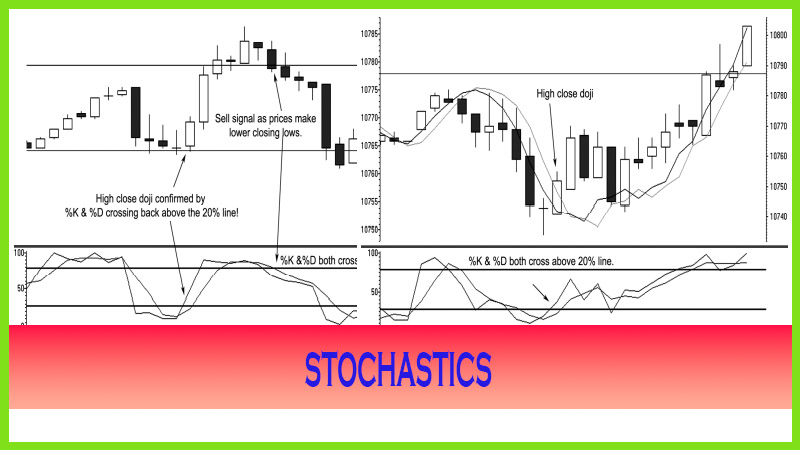
Course: [ The Candlestick and Pivot Point Trading Triggers : Chapter 3. Using Read Oscillators to Spot Overbought ]
In simplest terms, moving average convergence/divergence is an indicator that shows when a short-term moving average crosses over a longer-term moving average.
MACD
In simplest
terms, moving average convergence/divergence is an indicator that shows when a
short-term moving average crosses over a longer-term moving average. Gerald
Appel developed this indicator as we know it today, and he developed it for the
purpose of stock trading. It is now widely used for short-term trading signals
in stocks, futures, and forex markets, as well as for swing and position
traders. It is composed of using three exponential moving averages. The initial
inputs for the calculations were a 9-period, a 12-period, and a 26-period. The
concept behind this indicator is to calculate a value, which is the difference
between the two exponential moving averages, which then compares that to the
9-period exponential moving average. What we get is a moving average crossover
feature and a zero-line oscillator, and that helps us to identify overbought
and oversold market conditions.
I might
add that because traders are now more computer savvy than ever before and
because many charting software packages such as RealTick allow traders to
change or optimize the settings or parameters, it is easy to change, or
“tweak,” the variables in Appel’s original calculations. Traders can increase
the time periods in the moving average calculations to generate fewer trade
signals and can shorten the time periods to generate more trade signals. Just
as is the case for most indicators, the higher the time periods used, the less
sensitive the indicator will be to changes in price movements. MACD signals
react quickly to changes in the market that is why a lot of analysts, including
myself, use it. It helps clear the picture when moving average crossovers
occur. It measures the relative strength between where current prices are as
compared to past time frames from a short-term perspective to a longer-term
perspective.
The MACD
indicator is constructed with two lines: One is the 9-period exponential
average (slow line), and the other is the difference between the 12- and
26-period exponential moving averages (fast line). In general, when the fast
line crosses above the slow line, a buy signal is generated; the opposite is
true for sell signals.
The MACD
also has a zero baseline component, called the histogram, that is created by
subtracting the slower signal line from the MACD line. If the MACD line is
above the zero line, prices are usually trending higher. The opposite is true
if the MACD is declining below the zero line. The MACD is a lagging indicator;
that is, it is based off moving averages. We want to look for the zero-line
crossovers to identify market changes and to help confirm trade entries or
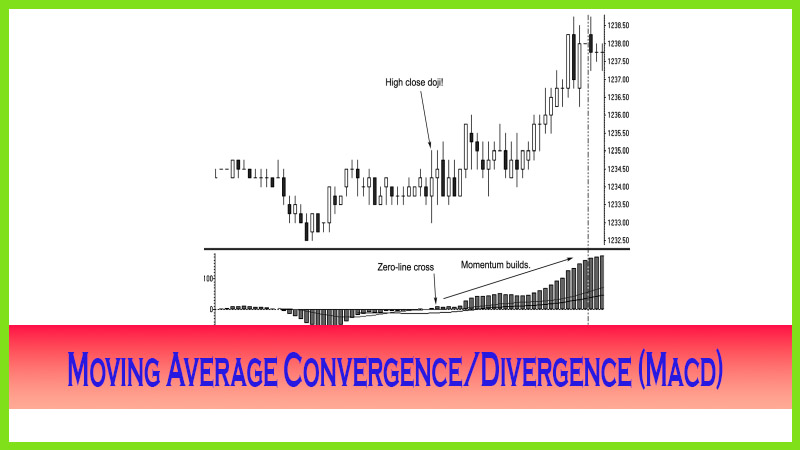
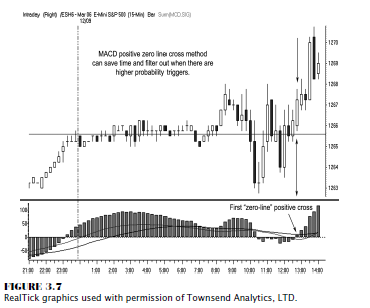
trigger action to exit a position. As you can see in the e- mini-Standard &
Poor’s (S&P) chart in Figure 3.7, the MACD readings cross back above the
zero line, indicating a confirmed shift in momentum. That zero-line cross
helped filter out the bottoming process. A long position would have been initiated
at the close of the candle or at the next time period’s open at 1267.25, which
resulted in an immediate price gain, carrying prices up over 1270.
Clues
that identify shifts in momentum as the market moves from one extreme to
another or from overbought to oversold to trigger a trading opportunity can be
identified with the aid of MACD readings in both the moving average and the
histogram component. While profits are higher when buying the absolute bottom,
that is a haphazard guessing game to play.
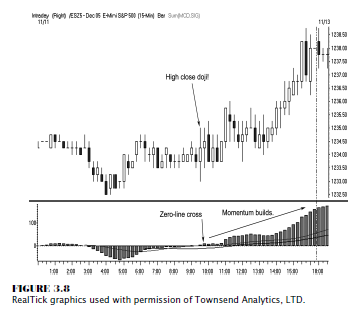
Trading
based on a set of rules and using a confirming indicator to identify a change
in price direction and then following that price movement are the keys to
making money in the markets. Figure 3.8 shows an e-mini-S&P example; the
intraday trend is established to be higher by 10 a.m., as the symmetry of
higher highs and higher lows exists. The MACD confirms an HCD trigger as the
histogram bar crosses above the zero line, initiating a long at 1234.75. Notice
that the histogram bars continue to expand higher, confirming that the bullish
momentum is accelerating. Identifying a zero-line cross is a powerful tool in
confirming entries, and watching the progression of the histogram bars may help
you maintain a winning position.
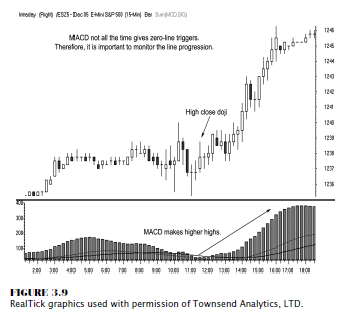
It is not
in every single instance that we see the MACD signals work exactly the same as
Figure 3.9 demonstrates. The histogram was not under the zero line; therefore,
a zero-line cross did not trigger. However, observing that the histogram bars
move higher as prices start to advance would certainly help confirm the
strength of the uptrend.
The Candlestick and Pivot Point Trading Triggers : Chapter 3. Using Read Oscillators to Spot Overbought : Tag: Candlestick Pattern Trading, Forex, Pivot Point : macd on chart indicator, macd signal, macd full form, macd indicator how to use, macd settings - Moving Average Convergence/Divergence (Macd)