Stochastics Patterns
stochastic rsi patterns, what does stochastic rsi indicate, how to set stochastic
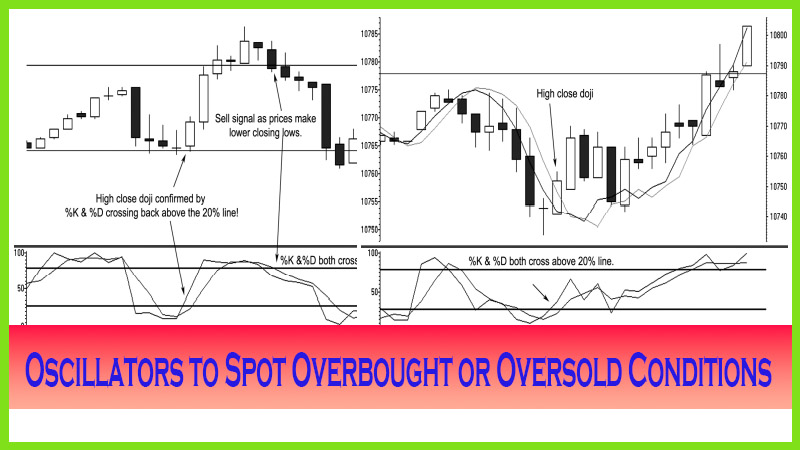
Course: [ The Candlestick and Pivot Point Trading Triggers : Chapter 3. Using Read Oscillators to Spot Overbought ]
One other method in which to use the stochastics indicator is trading off a pattern called bullish convergence. It is used in identifying market bottoms—where the market price itself makes a lower low from a previous low, but the underlying stochastics pattern makes a higher low.
Stochastics Patterns
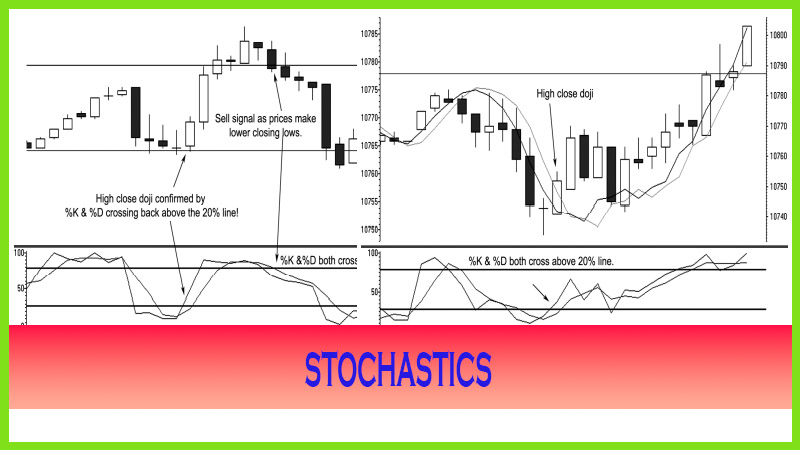
One other
method in which to use the stochastics indicator is trading off a pattern
called bullish convergence. It is used in identifying market bottoms where the
market price itself makes a lower low from a previous low, but the underlying
stochastics pattern makes a higher low. This indicates that the low is a “false
bottom” and can resort to a turnaround for a price reversal. Figure 3.4 shows
how prices make a secondary low significantly lower from a primary low, which
is posted by a low in the stochastics indicator.
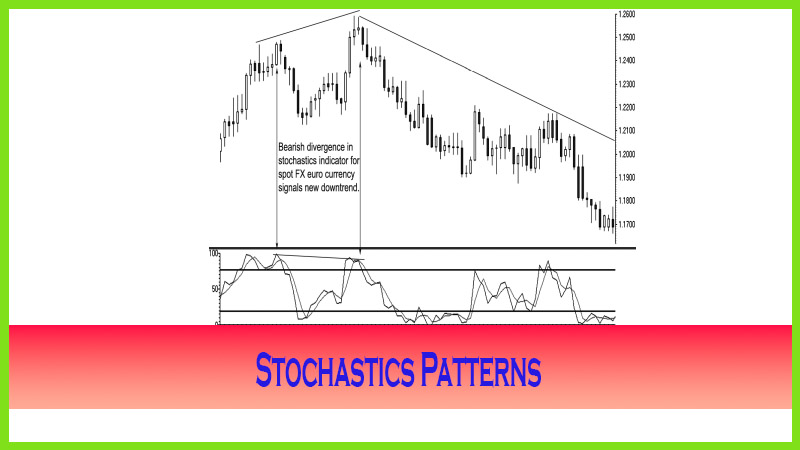
The
reverse of this signal is a trading pattern called bearish divergence. It is
used in identifying market tops—where the market price itself makes a higher
high from a previous high, but the underlying stochastic pattern makes a lower
high. This indicates that the second high is a “weak” high and can resort to a turnaround
for a lower price reversal. Figure 3.5 shows how the market makes a secondary
high, but the corresponding high in the stochastics is at a lower level than
the price charts’ primary high point.
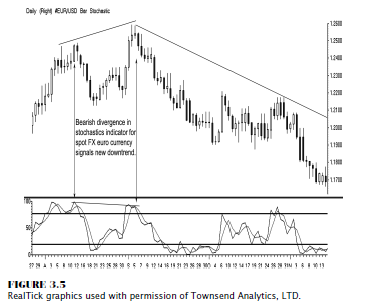
This
stochastic pattern can alert you to a false breakout. Notice the low close doji
(LCD) off the secondary peak; and then as %K and %D both cross over and close
back beneath the 80 percent line, a sell trigger is generated. That signal
warns of an impending, prolonged downtrend of substantial proportion.
Therefore, it is important to monitor for divergence patterns.
Rules to Trade By
The bearish divergence pattern signals that there is an impending price reversal ready to occur in a market. As I mentioned previously, you can anticipate and get ready to place an order to act on the signal; but you should not act until the confirmation of a lower closing low triggers the entry, which would be to act on the close or the next open. Here are four rules to guide you to trading a stochastics divergence pattern:
- The first peak in prices should correspond with a peak in the %K and %D reading above the 80 percent level.
- The second peak must correspond to a significant higher secondary price high point.
- If the secondary stochastics peak is less than or under the 80 percent level, this signals a stronger sell signal.
- Prices should make a lower closing lower to confirm a trigger to enter a short position. Enter on the close of the first lower closing low or the next open. The protective stop should initially be placed above the high of the secondary high.
Figure
3.6 demonstrates a bearish divergence setup with the rules described. This is a
15-minute candle chart on the CBOT mini-Dow. The secondary high is established
at 10940. Both %K and %D make a primary high above the 80 percent line, and the
secondary high in price corresponds with %K and %D below the 80 percent level.
Once the long dark candle closes below the prior low (in fact, it closes below
five prior candles lows), a sell signal is triggered. The initial entry is made
on that time period close or on the next open, which in this case is 10897.
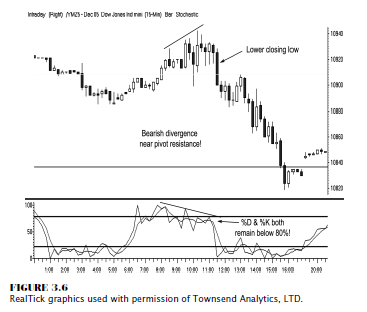
The stop
is placed at 10945, above the high of the secondary peak high. As you can see,
the market continues to decline into the close down to 10836, for a 61-point
gain had you exited on the close. That equates to a gain of $305 on a day trade
margin of $500 per contract. Notice that as the market declines, the
stochastics indicator remains below the 20 percent line as the %K and %D cross
multiple times but never back above the 20 percent level to trigger a buy
signal until after the electronic day session close, which is 4 P.M. (CT).
The Candlestick and Pivot Point Trading Triggers : Chapter 3. Using Read Oscillators to Spot Overbought : Tag: Candlestick Pattern Trading, Forex, Pivot Point : stochastic rsi patterns, what does stochastic rsi indicate, how to set stochastic - Stochastics Patterns