Stochastics Trading Strategy
stochastic rsi strategy, stochastic oscillator strategy, stochastic indicator strategy, stochastic forex trading strategy, stochastic day trading strategy
Course: [ The Candlestick and Pivot Point Trading Triggers : Chapter 3. Using Read Oscillators to Spot Overbought ]
Stochastics, a range-based oscillator, is also considered a momentum oscillator. George C. Lane is credited with creating the formula.
STOCHASTICS
Stochastics,
a range-based oscillator, is also considered a momentum oscillator. George C.
Lane is credited with creating the formula. I had the privilege of working for
George back in 1980. His indicator is a popular technical tool used to help
determine whether a market is overbought, meaning that prices have advanced too
far too soon and are due for a downside correction, or oversold, meaning that
prices have declined too far too soon and are due for an upside correction.
Stochastics is based on a mathematical formula that is used to compare the
settlement price of a specific time period to the price range of a specific
number of past periods.
The
method works based on the premise that in a bull, or up-trending, market,
prices will tend to make higher highs and that the settlement price, or close,
will usually tend to be in the upper end of that time period’s trading range,
or at least closer to the high. When the momentum starts to fade, the
settlement prices will start to push away from the upper boundaries of the
range; and the stochastics indicator will show that the bullish momentum is
starting to change. The exact opposite is true for bearish, or downtrending,
markets.
There are
two lines that are referred to as %K and %D. These are plotted on a horizontal
axis for a given time period, and the vertical axis is plotted on a scale from
0 percent to 100 percent. As you will see from the formula, %K will be the
faster of the two lines and will change direction because the %D line is a
moving average of %K. The unique feature of the stochastics reading is the
moving average crossover feature.
Stochastics
is a range-based oscillator with readings between 0 per-cent and 100 percent.
The main guidelines reflect the thought that readings over 80 percent indicate
that a market condition is overbought and ripe for a downside correction and
that readings under 20 percent signal the market is oversold and ripe for a
bounce. While that certainly is the case, generally speaking, I look for more
clues within the indicator to trigger a trade signal.
The formula to calculate the first component for fast stochastics using a 14-period look back setting for %K is:
%K = c - Ln/Hn - Ln * 100
where c = closing price of current
period
Ln =
lowest low during n period of time
Hn =
highest high during n period of time
n =
number of periods
The second calculation is the %D (3-period). It is the moving average of %K.
%D = 100(Hn/Ln)
where HN = the n period sum of (c - Ln)
RULES TO TRADE BY
When
using stochastics as a confirming tool, I see the indicator corroborate the
timing of a market turn associated with a higher closing high, especially when
it is in proximity of a targeted support level based off a pivot point level.
These rules will help to make better trading triggers for buy and sell signals.
· When the readings are above 80 percent
and %K crosses below the %D line and both lines close back down below the 80
percent line, then a “hook” sell signal is generated.
· When the readings are below 20,
percent, once %K crosses above %D, and once both lines close back up above the
20 percent level, then a “hook” buy signal is generated.
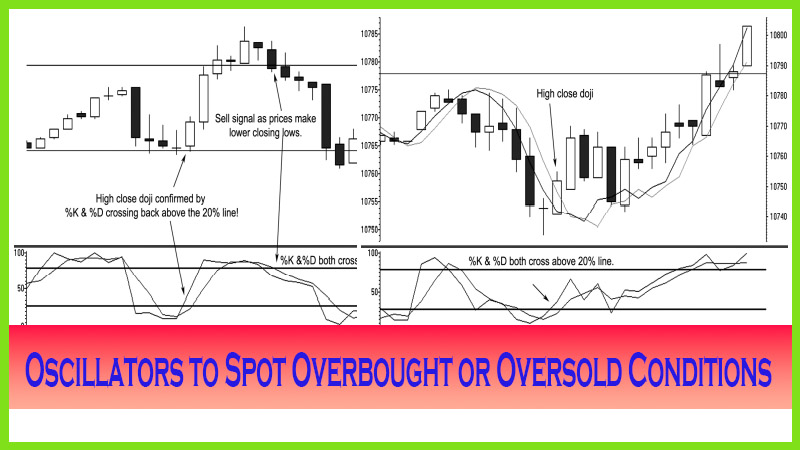
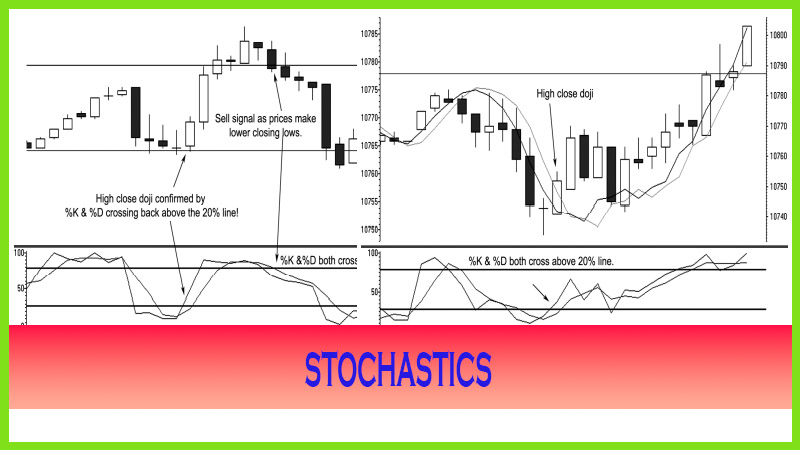
The
market in Figure 3.1 is a 15-minute candle chart on the Chicago Board of Trade
(CBOT) mini-Dow contract. The buy signal or trigger is generated once %K and %D
both cross over and back above the 20 percent line. It also confirms the first
time after the downtrend that the market makes a higher closing high.
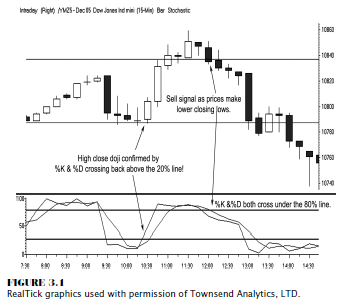
We have
not yet discussed candle patterns; but for those already familiar with that
charting method, you will notice that it is a higher close above the doji high.
The trigger to go long is on the close or the next open, once the market makes
a higher closing high, which in Figure 3.1 would be at 10810.
When the
market trades near the daily projected resistance, as determined by using pivot
point analysis, once prices start to make lower closing lows, which is a clue
that helps us identify that the uptrend has concluded. That is what generates a
sell signal at 10838. That would be a profitable scalp of 28 points at $5 per
point, which is $140 on a day trading margin of $500, which is what most
futures brokerage firms charge.
STOCHASTICS CONFIRMS THE TURN
Now
looking at the sell signal, we would have an opportunity to go short at 10838
as the market pivots and turns, as I say, off the resistance level as the
stochastics confirms with a %K and %D hook sell signal once both lines cross
and close below the 80 percent line. Follow the flow of the market after that
point: lower highs, lower lows, and, more important, lower closing lows all the
way down to a low of 10739. That is a 99-point decline or $495 per
contract almost a 100 percent return on your day trading margin. As the market
declines, we see the stochastics crossing above and back below its respective
values; but never does it cross back and close above the 20 percent line. I am
asked at what level do you take profits. I will go over specific target exit
levels later; but for right now, the most simplistic answer is at the last trading
price near 10758. The reason is that this would have been a day trade; and as
you can see from the bottom of the chart, the day is running short on time.
Profit objectives can be based not only on price targets but also on time
limits.
Figure
3.2 shows a pattern similar to that in Figure 3.1: a higher close above a doji
high. Candle chart aficionados may see a variation of a morning doji star
pattern. I keep it very simple; I call it an HCD pattern, which stands for a
high close doji. This pattern has specific rules on entry and exits and will be
disclosed in just a bit. For now, please focus your attention on the fast
stochastics, as %K and %D both confirm the trigger to go long once both lines
cross and close above the 20 percent line. That trigger corresponds on the
close of the candle, which was 10756. As the market moves higher, follow the
flow again as the momentum builds. The stochastics does not generate a sell
signal, as the high was made at 10805. We see a crossover of %K and %D above
the 80 percent line, but the stochastics does not close back under that line.
The 20
percent and 80 percent levels in relationship with the %K and %D values will
help confirm your entries and exits in the markets, especially when you follow
the trend or market flow as shown by the candle charts.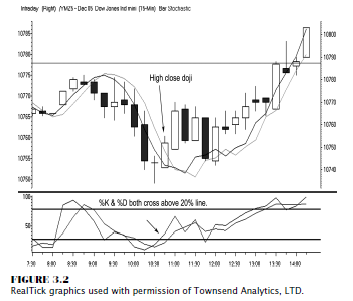
There is
a reason why I have focused on the high close doji signal, as we shall soon
discover from a back-test study on percentile perspective. But once again, this
chapter is to help you better understand the confirming power that stochastics
offers.
Markets
need volatility in order to move, and we need markets to move in order to
trade. We also need to base our trading plans on reliable signals. Not all
times do the setups that trigger an entry work as perfectly as in these
examples, which is why I have other confirming signals to corroborate timing a
trade signal. I also like to see if the methodology works in a diverse group,
or non-correlated markets. Testing for robustness, or how well a system or
signal responds in different markets, helps validate the reliability of that
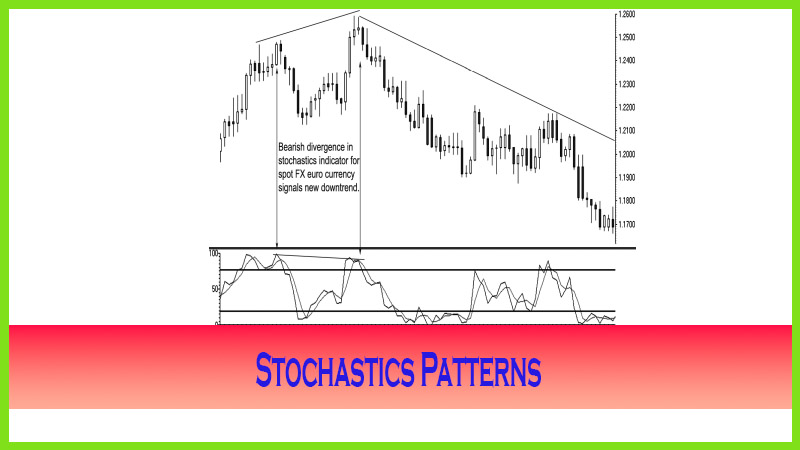
signal. The chart in Figure 3.3 is a spot forex euro currency that demonstrates
the same setup and trigger that would enter a long position with %K and %D
crossing over above the 20 percent line with a confirming higher closing high
candle pattern.
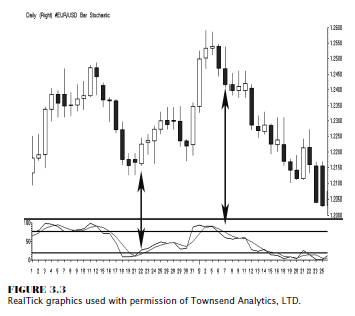
The sell
signal also works well as confirmed when %K and %D both cross over and close
back below the 80 percent line.
TIPS AND TRICKS TO HELP
There are
other tips and tricks associated when using stochastics. There are fast
stochastics and slow stochastics. The difference is in how the parameters are
set to measure the change in price. This is referred to as a gauge in
sensitivity. A higher rate of sensitivity will require the number of periods in
the calculation to be decreased. This is what “fast” stochastics does. It
enables one to generate a faster and a higher frequency of trading signals in a
short time period. The previous two examples used the default fast stochastics
settings, which help you discover the cycles of tops and bottoms faster than
the slow stochastics setting will.
The Candlestick and Pivot Point Trading Triggers : Chapter 3. Using Read Oscillators to Spot Overbought : Tag: Candlestick Pattern Trading, Forex, Pivot Point : stochastic rsi strategy, stochastic oscillator strategy, stochastic indicator strategy, stochastic forex trading strategy, stochastic day trading strategy - Stochastics Trading Strategy