How to Read Oscillators to Spot Overbought or Oversold Conditions
“trading against the trend, Stochastics trading strategy, Stochastics Patterns, MACD
Course: [ The Candlestick and Pivot Point Trading Triggers : Chapter 3. Using Read Oscillators to Spot Overbought ]
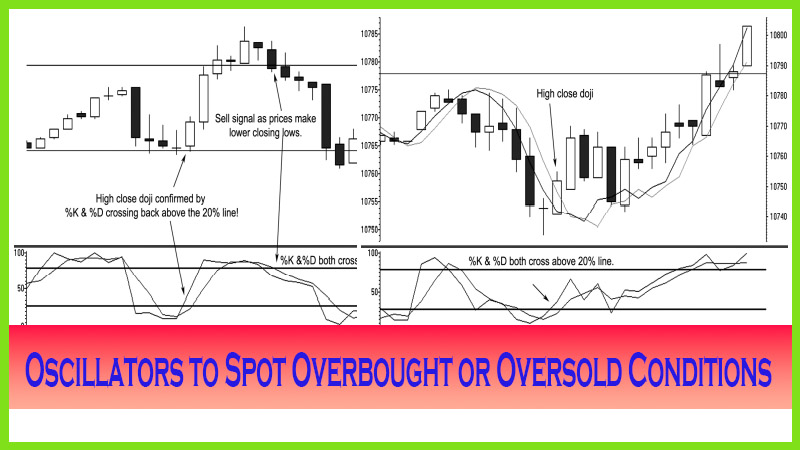
In a bullish market environment, prices break out of a previous range and trade higher. Depending on the move, sometimes the market reaches an unsustainable extreme, which we refer to as “overbought.”
How to Read Oscillators to Spot Overbought or Oversold Conditions
In a
bullish market environment, prices break out of a previous range and trade
higher. Depending on the move, sometimes the market reaches an unsustainable
extreme, which we refer to as “overbought.” After all, market prices can’t go
up forever without a pause. The outcome varies when markets reach overbought
conditions. They can, as stated, pause or consolidate, correct back down a bit,
or completely reverse the entire price advance. Understanding when a market is
likely to reach an overbought condition is vital to knowing when to take a
profit in a long position, especially after a long uptrend, or when to profit
from a countertrend trade opportunity. This is also referred to as a
“mean-reverting strategy” or “trading against the trend.”
We can
measure or profile a market price extreme several ways: One is by looking at
past price resistance levels; another is by looking at the strength or weakness
of the market’s move by using certain technical indicators that measure the
current price, relative to previous highs and lows.
Some of
my favorite tools that I use to compliment my trading method include predictive
analysis based on pivot point studies, as we will see in the following
chapters, with a strong emphasis on studying pure price action, as we discussed
in Chapter 2, by identifying higher closing highs in an uptrend and lower
closing lows in a downtrend.
I look to
identify certain chart patterns or a signal that shows a shift in momentum; and
then I look for a sequence of events, such as higher closing highs at
predetermined support levels or lower closing lows at predetermined resistance
levels determined by the aid of pivot points analysis, into which I incorporate
various time frames to help me pin down reversal target levels. This method is
great for short-term day trading to long-term investing. This method also works
when I am looking at a swing trade, which is a trade that may last anywhere
from one to three days. For longer- term trading, I use volume studies in the
stock and futures markets to help me confirm the strength or weakness of a
trend or to gather a clue as to when a major reversal is ready to occur. For
spot foreign exchange (forex) currency trading, volume figures are available to
use from the futures markets; but because those figures are not available until
the end of day, they are not good day trading indicator tools. Therefore, the
use of oscillators and indicators help to confirm the condition of the market
once I am in a trade or about to make a trade based on an extreme price swing.
Some
questions that are often asked when I am giving a seminar or a presentation at
a conference are: How many indicators do you suggest using at one time? Do you
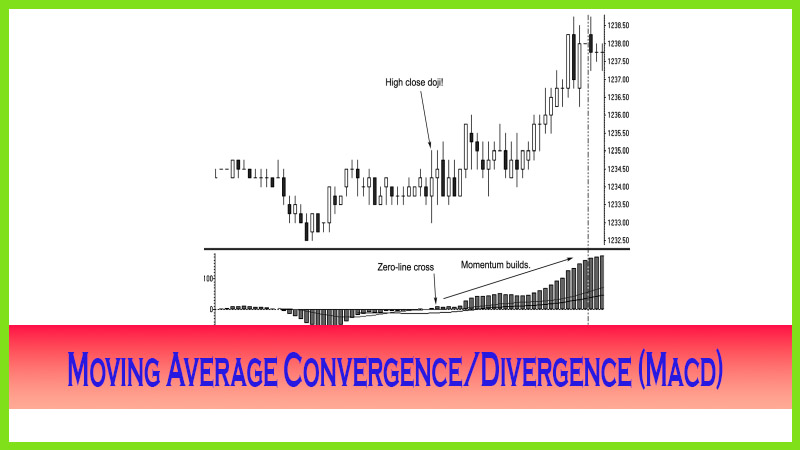
get analysis paralysis from using too many? The answer is that I use two
indicators: stochastics and moving average convergence/divergence (MACD).
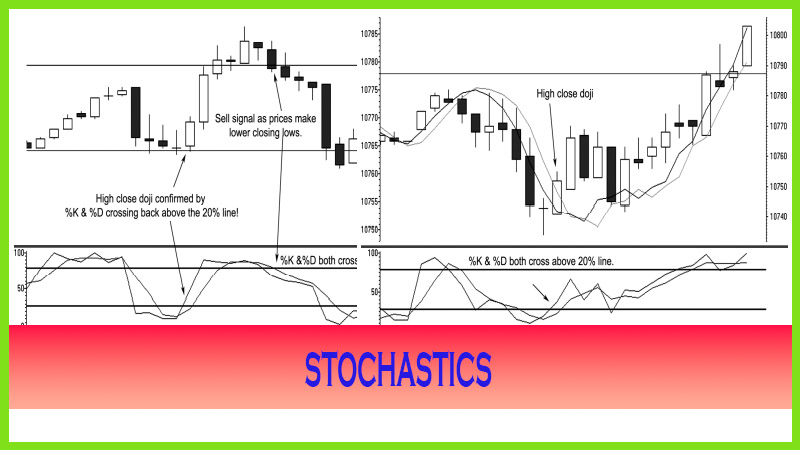
Since
trending conditions exist for less than 30 to 40 percent of the time, you can
anticipate that after a nice trend directional move, the market will move in a
consolidation phase, or “whipsaw” as most people call it. In choppy range-bound
conditions, stochastics is your friend; in trending market conditions, MACD
will give you solid signals.
The myth surrounding MACD is that one
of the best indicators out there is not necessarily true. So goes the old adage
that there is no holy grail for any single trading indicator or style. This is
due to the fact that markets change, as do market conditions and people’s
perception on a product’s given value or anticipated value in any given time. I
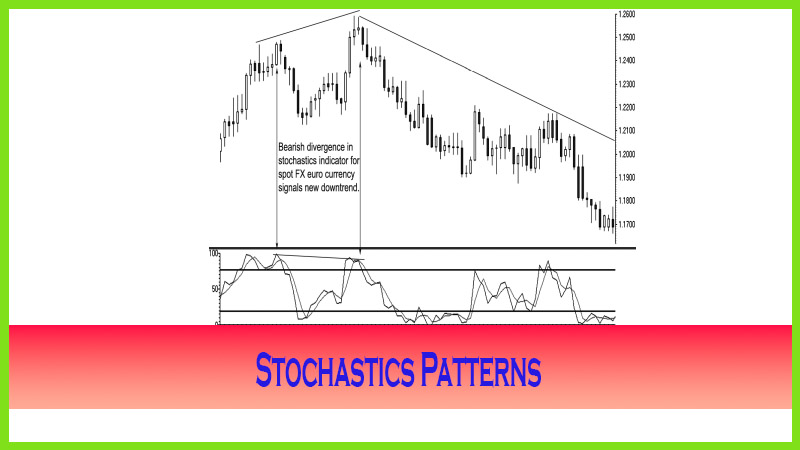
believe that the stochastic indicator is a more useful tool than the MACD
during certain market conditions and for determining various signals, such as
divergences or convergences. They both can be used for pinpointing reversals.
It is
likely that one will give a faster signal than the other, and vice versa. The
one fact is that in trending markets, MACD can be your friend by helping you to
stay in a trade longer, thus milking a position for more than you would
imagine. This chapter will show several rules and techniques for using both of
these indicators.
The Candlestick and Pivot Point Trading Triggers : Chapter 3. Using Read Oscillators to Spot Overbought : Tag: Candlestick Pattern Trading, Forex, Pivot Point : “trading against the trend, Stochastics trading strategy, Stochastics Patterns, MACD - How to Read Oscillators to Spot Overbought or Oversold Conditions