Cotton Futures
Equity market, Best Trading Strategy
Course: [ Harmonic Elliott Wave : Chapter 7: A Case Study in EURUSD ]
Elliott Wave | Forex | Fibonacci |
As a second example of a commodity future I have included the (A)(B)(C) rally in cotton from the 1985 low to the 1995 high.
Cotton Futures
As a second example of a commodity future I have
included the (A)(B)(C) rally in cotton from the 1985 low to the 1995 high. The
results display a slightly larger variance from normal harmonic ratios in some
instances, but overall the combination of the ratios across the wave degrees do
tend to confirm the harmonic structure.
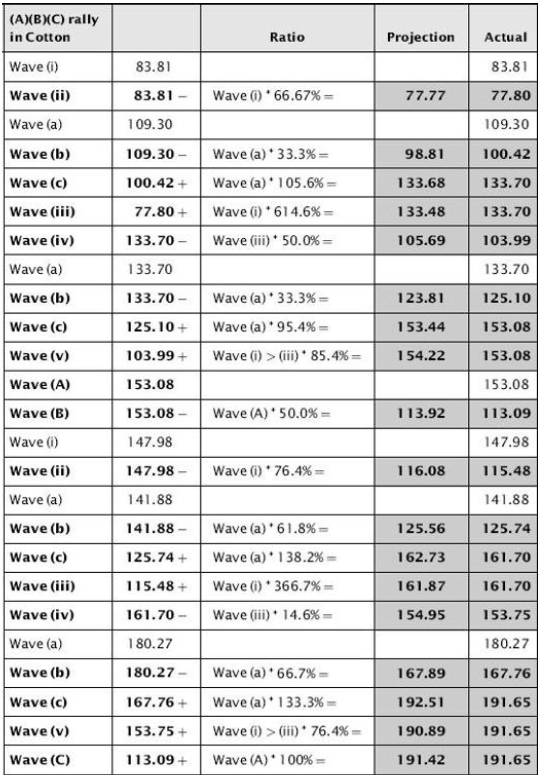
To support the chart shown in Figure 7.17. Table
7.21 provides the ratios during the rally.
Figure 7.17 (A)(B)(C) Rally in Cotton Futures
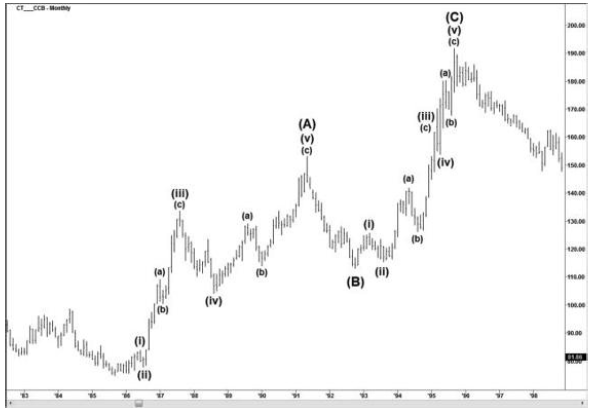
Table 7.21 Ratios for (A)(B)(C) Rally in Cotton Futures
Harmonic Elliott Wave : Chapter 7: A Case Study in EURUSD : Tag: Elliott Wave, Forex, Fibonacci : Equity market, Best Trading Strategy - Cotton Futures
Elliott Wave | Forex | Fibonacci |