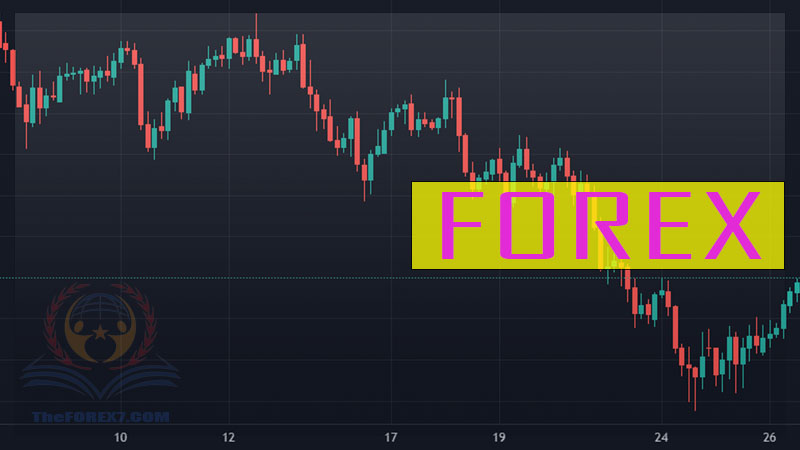
Learn Technical Analysis in Forex Trading - Best Tips for Technical Analysis
Identify Trend Direction, Breakouts Trade or Fade, How to learn Technical Analysis
Course: [ Top Trading Strategy ]
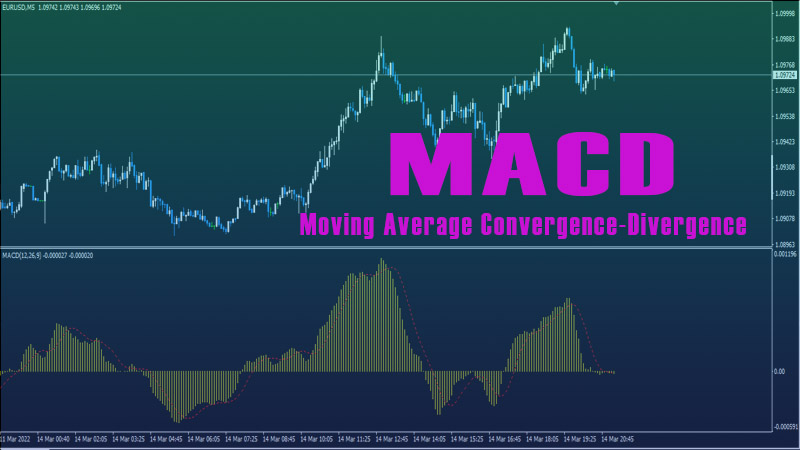
Now that you have gone through how to apply trend-following and momentum indicators to your charts, how do you make sense of all this information so that you are able to utilize these technical tools to their fullest advantage.
Technical Analysis Tips
Now that you have gone through how to apply
trend-following and momentum indicators to your charts, how do you make sense
of all this information so that you are able to utilize these technical tools
to their fullest advantage?
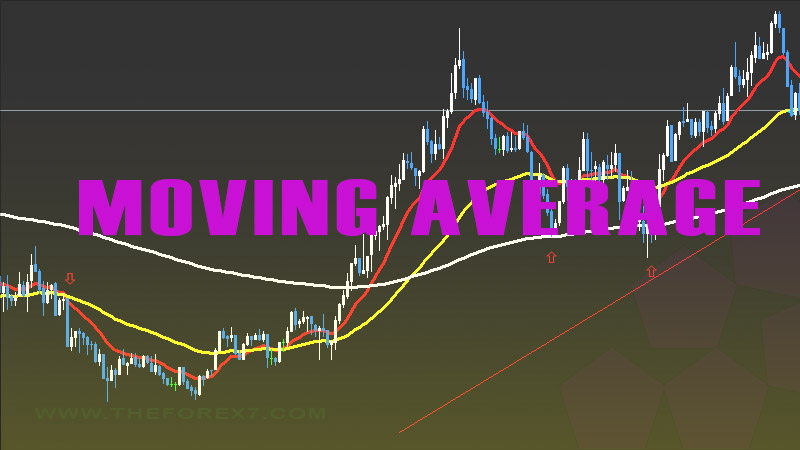
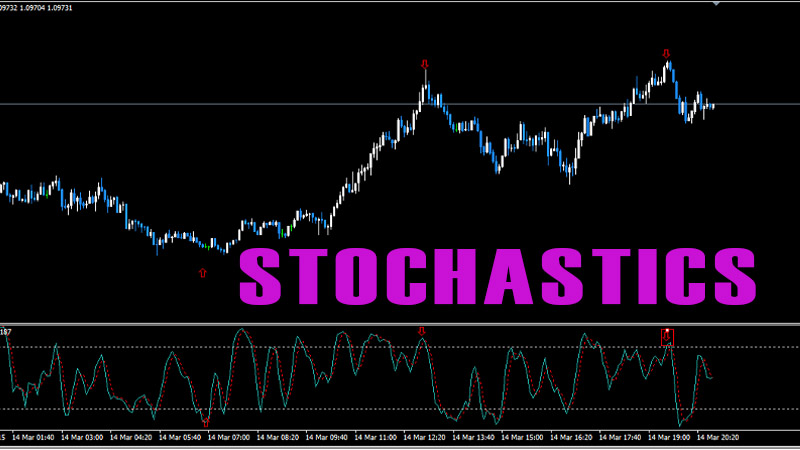
1. Identify Trend Direction
·
Uptrend
- Price data shows higher highs and higher lows; up
trend line can be drawn; moving averages sloping upward
·
Downtrend - Price data shows lower highs and lower lows; a downtrend line can be drawn; moving averages sloping downward
·
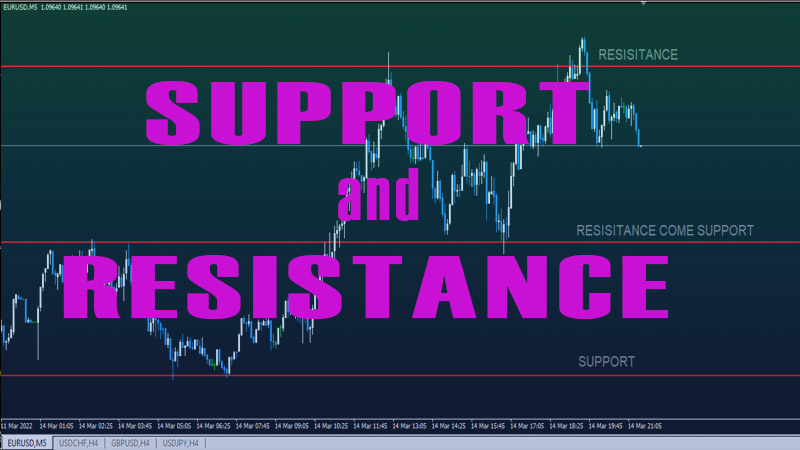
Sideways - Price data is confined in a range; a rectangle
can be drawn with the upper line as resistance and the lower line as support;
moving averages tend to be flat
2. Going with
Market Flow
·
If prices are in an
uptrend and the market sentiment is bullish - go long. Enter the uptrend when
prices have retraced to an appropriate entry point such as a Fibonacci
retracement level or moving average or trend line. Could also join the uptrend
when the price breaks above a previous high.
·
If prices are in a
downtrend and the market sentiment is bearish - go short. Enter the downtrend
when prices have retraced to an appropriate entry point such as a Fibonacci
retracement level or moving average or trend line. Could also join the
downtrend when the price breaks below a previous low.
·
If prices are
consolidating in a trading range, it is best to short the upper boundary and
long the lower boundary of the channel/rectangle. Keep in mind that bounces may
not occur exactly on the boundaries, so give enough allowance.
3. Going against Trend?
·
You may go against the
trend if you have reversal signals from the divergence of oscillators and price
and if the prevailing market sentiment supports the conditions for a trend
reversal. I usually only trade divergence if it shows up on daily or
longer-term charts, not 60 min or less charts.
4. Beware of Technical Obstructions
·
The disadvantage of
monitoring just a single time frame is that if you trade a breakout in that
time frame, you may not be aware that the breakout may not have happened yet on
another longer time frame, and hence your entry point would become
inappropriate. If you want to trade a trend line breakout, say, from a 60 min
chart, always double-check with the daily chart to make sure that the breakout
in the daily chart coincides with your entry price that is based on the 60 min
chart. For example, don't trade a downside breakout from an uptrend line in the
60 min chart if the price is still above the trend line in the daily chart.
Your entry point could still be 20-30 pips above the trend line break in the
daily chart, and that trend line support would certainly obstruct your trade
and might cause you to be stopped out because of expected bounces off the daily
trend line. The reverse applies to trading an upside breakout from a down-trend
line.
·
It is always
better to be second than first in a trade if the second entry point is safer.
For example, you might want to think twice about shorting from the neckline
break of a chart pattern if a Fibonacci retracement level or moving average
lies not far below from that level. In that case, it would be much better and
safer to short only when the price breaks below this obstruction, and not
during the first break. Many times, the price would reverse at this obstruction
level and stop out your entry point at the first break. It certainly pays to be
second than first in the Forex market.
·
Technical obstructions
may appear on another currency pair that you are not trading. This frequently
occurs between EUR/USD and USD/CHF. Monitor the price movements of both pairs,
and see which pair is leading the other. However, being the leading pair
does not mean that it is the more influential pair of the two at the moment. For
example, the price movements of USD/CHF may be ahead of EUR/USD, and it has
just broken above a resistance level. It may turn out that the true
sustainability of this USD/CHF breakout would depend on whether EUR/USD is able
to break below its own support level, especially if it is a very critical and
significant level. If EUR/USD fails to break below its support, then chances
for a failed upside breakout in USD/CHF are very high. It takes a lot of
skills, experience and some guesswork to predict which levels are the ones that
most traders are eyeing and defending. You might be able to take a few clues
from what the impending economic releases are about and which country they are
relating to.
5. Breakouts - Trade or Fade?
Breakouts are notorious for being false many times
in currency charts. There are no hard and fast rules regarding whether to trade
them or to fade (go against) them. But there are several points you can take
note of:
·
If a breakout from a
significant level occurs hours or even 1-2 days before a very important and
widely anticipated economic data release, then most likely that breakout will
have no sustained demand/supply, and hence would have a higher likelihood of
failure. It may be better to fade them under these circumstances.
·
If a currency pair is
approaching a new high or low for the year based on the daily chart, the
breakout is very likely to fail if the support or resistance is extremely
strong. In such cases, it may be better to fade the breakout of this pair.
·
After failing to
penetrate strong resistance or support in the daily chart, the currency pair
tends to retrace around 100 pips from that failed level as many traders are
caught on the wrong side of the market.
Bonus Tips for Technical Analysis
·
Big moves occur when
the majority of the market is positioned on the wrong side. So, for
example, if you are going long together with the majority of the market on a
pair, and suddenly the market reverses due to some news or comments, it may be
wise to liquidate your positions and take your losses or profits quickly, and
do a flip by taking a net short position on the new way down.
·
Don't give in to fear
or greed when it seems that everyone is selling or everyone is buying.
Emotions have no part in your trading decisions. If you want to sell when
everyone is selling or buy when everyone is buying, do so based on technical or
fundamental reasons, not your emotions!
·
The best trades are the
ones that seem the most 'risky', that is, buying at the bottom when
everyone is scared to buy or selling at the top when everyone is consumed by
greed. The best places to do so are when the prices approach trend line support
or resistance, and when market conditions do not support a sustained breakout.
·
One of my precious
trading rules is never to open any new positions before an important economic
data release on the day itself. You may have very strong technical reasons to
do so, but if the news go against your way, your trade is dead. It is just not
worth the risk to me.
·
Too much too fast rule:
If the price has moved by a lot, say, 100 pips, within a short time (in less
than 3 hours) without any retracement or consolidation, don't try to join the
trend unless there is a strong violation of a significant technical level. If
you have already missed the previous entry signals, stay out!
·
Whatever goes up must
come down! Prices don't go up forever or fall forever. Keep this in mind when
you are gripped by fear or greed.
Top Trading Strategy : Tag: Top Trading Strategy, Forex : Identify Trend Direction, Breakouts Trade or Fade, How to learn Technical Analysis - Learn Technical Analysis in Forex Trading - Best Tips for Technical Analysis