The Sample Analysis
How to back testing in mt4, Back test, three-period pivot point moving average
Course: [ The Candlestick and Pivot Point Trading Triggers : Chapter 11. The Sample Analysis ]

Short-term system traders make their money, leave the game, and wait to execute the next setup; they don’t have to worry about being an economist. They get in when the signals indicate and get out when the signals dictate.
The Proof Is in the Back-Testing
Short-term
system traders make their money, leave the game, and wait to execute the next
setup; they don’t have to worry about being an economist. They get in when the
signals indicate and get out when the signals dictate. It has been stated many
times and proven by history that traders who consistently make money are those
who follow a program or a set of predefined rules. These rules have been
tested, and they correspond in a variety of time periods and with diversified
or non-correlated markets.
You may
have made observations on changes in the market, such as when the stock index
futures are trending up by 10:30 a.m. (CT) on a Friday, the market has a
tendency to trade higher through the end of the day. With that said, once
you have a trading idea about the way a market moves, through your own
observation, you can apply it to computer code and have a computer generate an
alert to inform you when a signal is generated.
Through
the proficiency of computers, we can take historical data and back-test the
results to see how reliable and accurate the theories are. Not all systems work
well. Some are good in trending market conditions, and others will work well in
non-trending market environments. Therefore, it is important to back-test a
methodology for various time periods and in various noncorrelated markets to
see if the principles are sound and stand the test of time. So far, with what
we have gone over, you can develop your own rules based on pivot point and candlestick
patterns.
One such
example is if we assign a positive (+) value to a candle with a higher close
than open, if you have a sequence of three positive values after a succession
of, say, five negative (-) values, and if the low of a given candle is within
two ticks, or 5 percent of, the average daily range on a 10- day average, then
a buy signal is triggered. Another way of stating this is:
- For a positive assigned candle:
Close (C) is greater than open (O) ( C
> O)
- For a negative assigned candle:
Close is less than open (C < O)
- For a doji candle, with a neutral (=) assigned value:
Close is equal to open (C = O)
- You can program your own system to generate an exit strategy based on an average holding period of, say, seven or eight periods or until the market forms a lower close than open (C < O) or a negative assigned value and if that time period closes below the prior time period’s low.
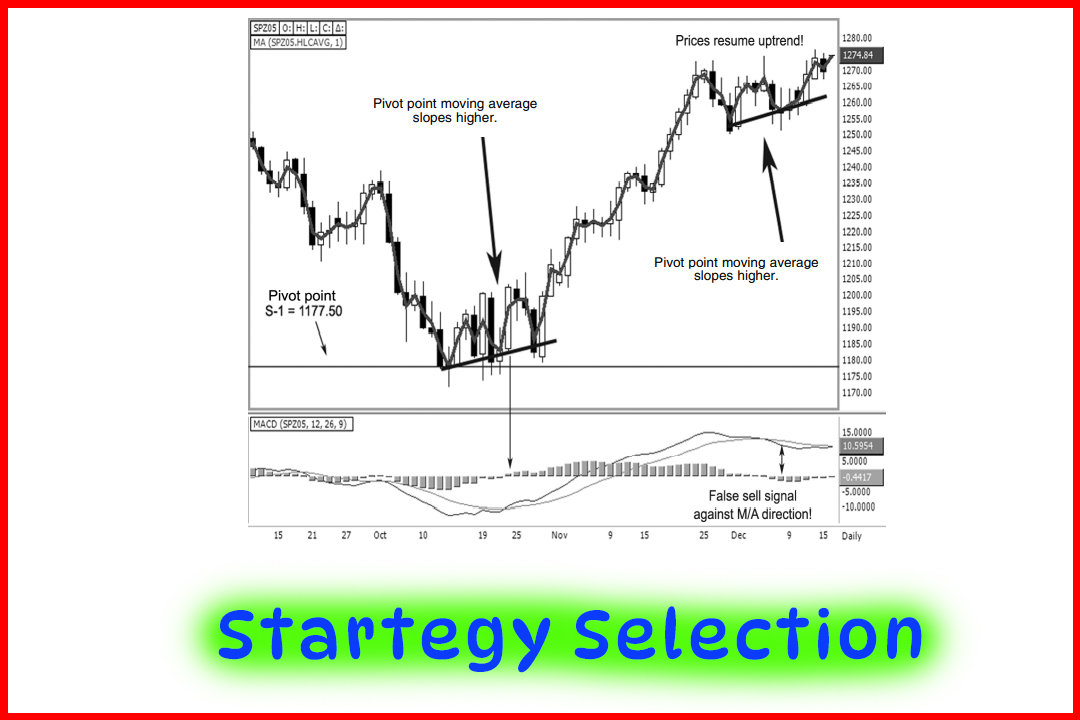
Another
methodology or system that is a simpler program would be to combine a
three-period pivot point moving average with a five-period pivot point moving
average. After a series of lower closing lows, once the three- period moving
average crosses above the five-period moving average and if the market was
within five points above or below a pivot point first support level (S-1)
target number, then a buy signal would be generated. For added optimization,
you could add a filter that if the stochastics indicator was below the 20
percent line, once %K and %D crossed and closed back above the 20 percent
level, a buy signal would trigger.
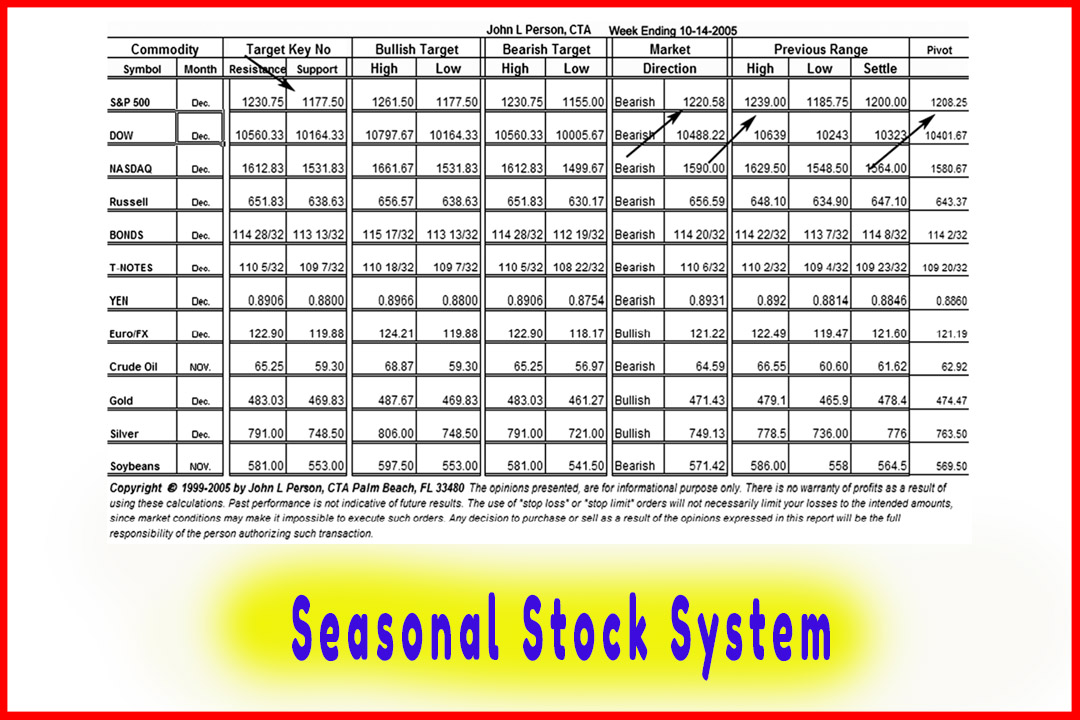
Using the
value of the pivot point resistance target of R-1 while combining the
three-period pivot point moving average with the five-period pivot point moving
average, once the three-period crossed and closed below the five-period pivot
point moving average, within five points either above or below the R-1, a sell
signal would be generated. For added fine tuning, you could add another
element, such as a stochastics reading, so if both moving averages were above
the 80 percent level and once %K and %D both closed back below the 80 percent
level, a sell signal would be triggered.
The hard
part in coding is comprehending or understanding the software language and then
thinking like a computer. You can’t just state “sell”
when stochastics gives a sell signal. The software or computer program
does not know what your interpretation of a sell signal is.
If you
recall, in Chapter 1, I suggested that traders need to ask more questions. That
is what a system trader does. In order to develop a trading plan or a
mechanical system, you need to search for answers to question such as:
- Will this be for day or position trading?
- Will volume studies be used and, if so, how?
- What will be the average holding period?
- What methods do we want to use and what parameter will we choose?
A trader
needs to use various tools to get the job done, so to speak. That is why I have
several trading platforms and quote services. Genesis Software allows me to
develop my own “black box” of algorithms and indicators and to back-test the program.
In order to develop a good system, you need to decide if the trading concepts
are valid. Once you have come up with your set of rules or criteria, then you
can start to optimize the program. You have heard of the “Keep It Simple” rule? Leonardo da Vinci is credited with saying “Simplicity is
the ultimate sophistication.” If Leonardo liked things simple, well
then, it is good enough for me, too!
A trading
system should be designed from simple yet effective rules that blend key
concepts of momentum changes and trending conditions. A well-defined trading
strategy can be developed to generate buy and sell signals in most markets in
various time periods. Believe it or not, designing a trading system is easy to
do once you have an idea of what the call to action, or the trigger, will be to
enter a position. In this book, we have gone over several good techniques with
which you can start, such as when indicators correspond near pivot points like
the stochastics 80 percent/20 percent close line technique or the moving
average convergence/divergence (MACD) zero-line cross signal. You can develop a
system based on these two indicators and then determine how many time periods,
or the length of time, a position should be in the market. Now all you need to
determine is how many holding periods (such as 4 or 8 periods) are needed
before an exit strategy is triggered. You can develop a trigger on moving
average crossover to initiate a signal, just like the pivot point moving average
we went over in Chapter 6 or a simple moving average using 5-period versus
10-period parameters. You will want to test the system over a lengthy time
frame and with various non-correlated markets. If there is any validity to the
rules or methods, then you should see positive performance across the board.
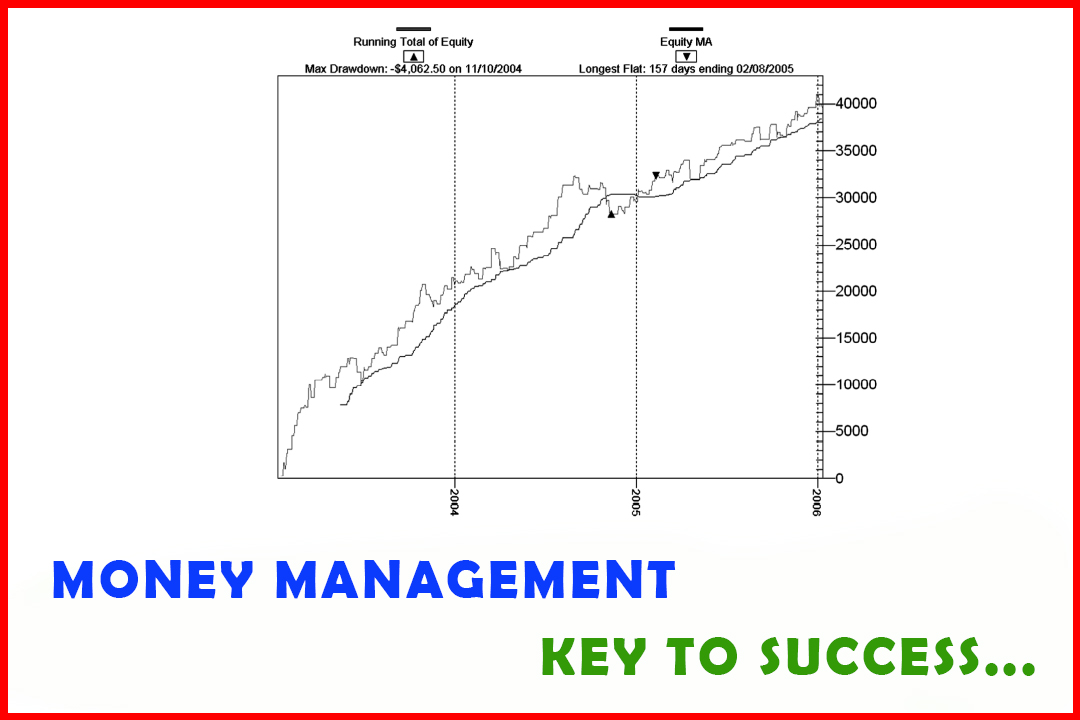
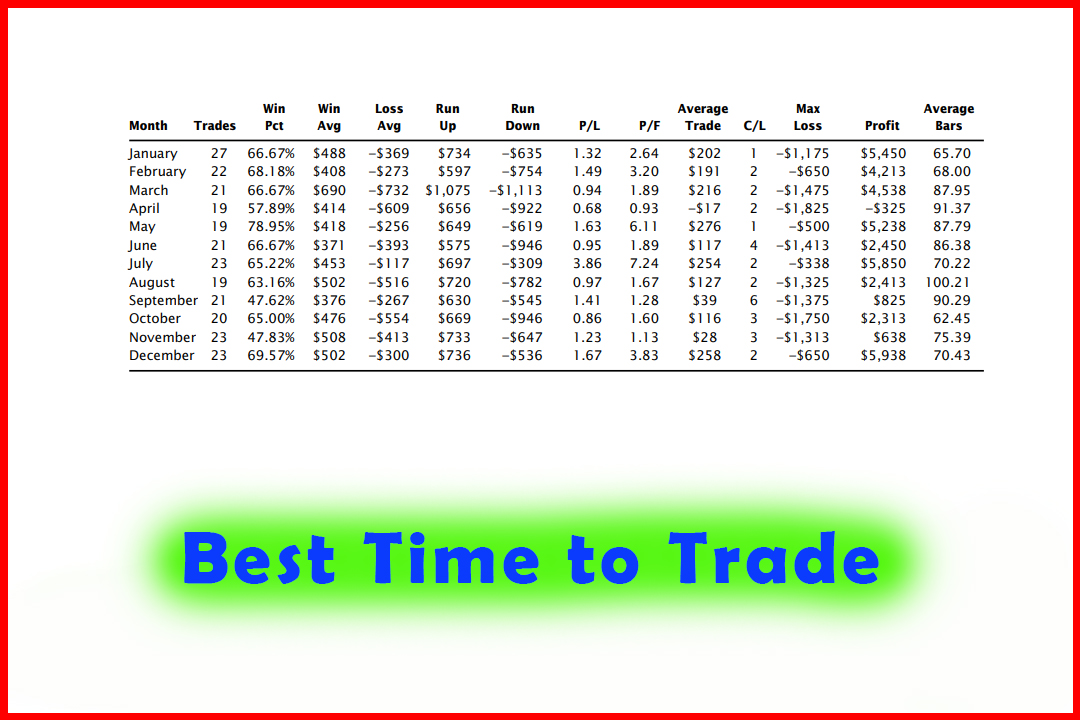
Not all
systems that show results of extremely high profit levels are best. A system
also depends on drawdowns, or periods of equity loss. Also, it is important to
have software that will show you a trading system’s weakness or will help point
out specific time periods or time frames in which you should not trade. Being
able to closely follow your drawdown patterns is a huge benefit to the
computer-friendly active systems trader, finding answers to such questions as:
What is the recovery period to gain back losses? What is the depth or magnitude
of the losses? These are very important questions because if a system has great
returns but absurd equity draw downs for long periods, then it is most likely a
poor system for an average investor to trade. When you are designing your
system, ask yourself what you want this system to do. The obvious answer is to
make money; but you also want to know how long and how deep the drawdown
periods are or whether there are consistently more winners than losers. As a
trader you need to evaluate new techniques, especially ones that increase your
profitability while reducing your risk and exposure in the market. Systems need
to be developed with the idea of triggering a turning point in the market earlier
than other indicators and other traders do. Considering that most indicators
are lagging, you need a signal that identifies turning points as they occur,
and you need to use indicators to confirm that the position is valid. Pivot
point analysis does just that, especially when combining support and resistance
levels and by implementing a moving average approach
One of
the best features or benefits to using mechanical trading systems is that they
alert a trader to initiate a trade or to act on a signal as it occurs, rather
than on a hunch or on the two main destructive emotional elements, fear and
greed. Based on a system that is tested, you have statistical evidence to
validate the entry; and that should help eliminate trading on a hunch, a rumor,
or a feeling, which is what drives most trading decisions from inexperienced
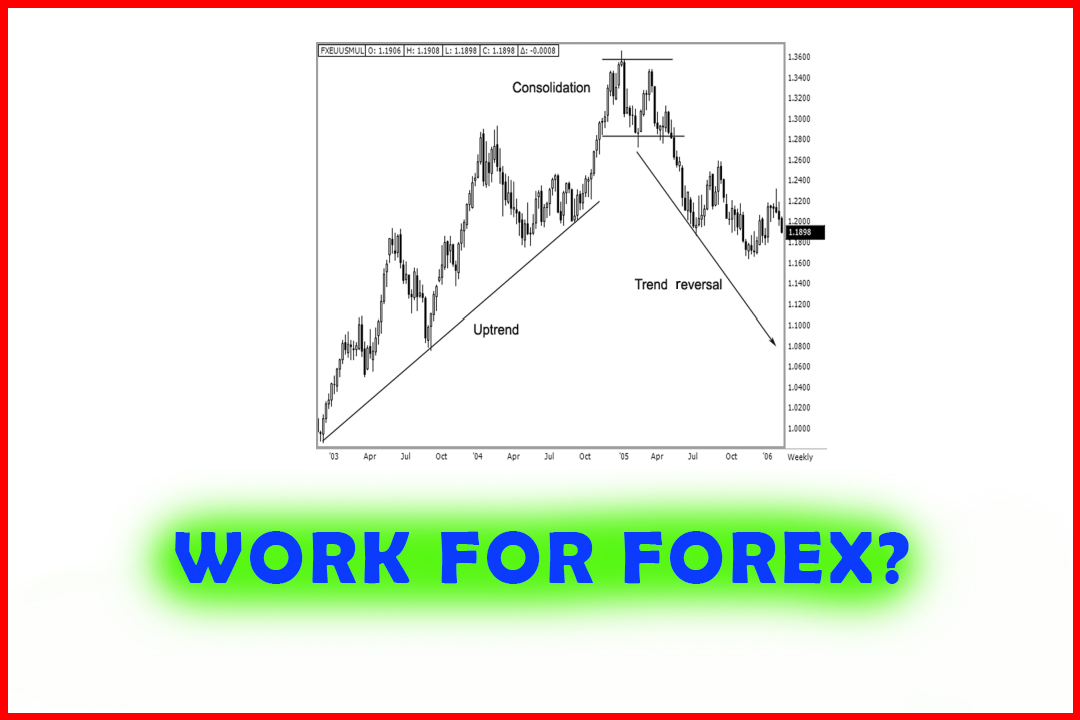
traders. As this book has demonstrated, it is not my intention to portray the
ability to buy the exact low or sell the exact high. In most cases, I am
looking for a definitive trend or price reversal to occur; and then I act on
that signal and carry a position until the market demonstrates a loss in
momentum, the time to exit the trade. The keys to winning are the ability to
practice patience and wait for the setup to develop and the discipline to act
on the trigger. Mostly, it is the ability to exit a losing trade as the signals
dictate, not to hang onto the loser. So when using a system, you will know and
understand that the mechanics are never 100 percent right and that you will
have a certain number of trades that do not work out. Once you come to grips
with that fact, it will be easier to embrace your losses rather than become
emotionally wrangled when they occur. Hopefully, you can learn from a trader
with long-term positive experiences. Good advice will get you ahead more
quickly than if you have to learn everything on your own, and it will help you
avoid costly mistakes. Take my advice: Learn a system, back-test it to see the
strengths and weakness of the method, and then trade on these testable signals.
The Candlestick and Pivot Point Trading Triggers : Chapter 11. The Sample Analysis : Tag: Candlestick Pattern Trading, Forex, Pivot Point : How to back testing in mt4, Back test, three-period pivot point moving average - The Sample Analysis