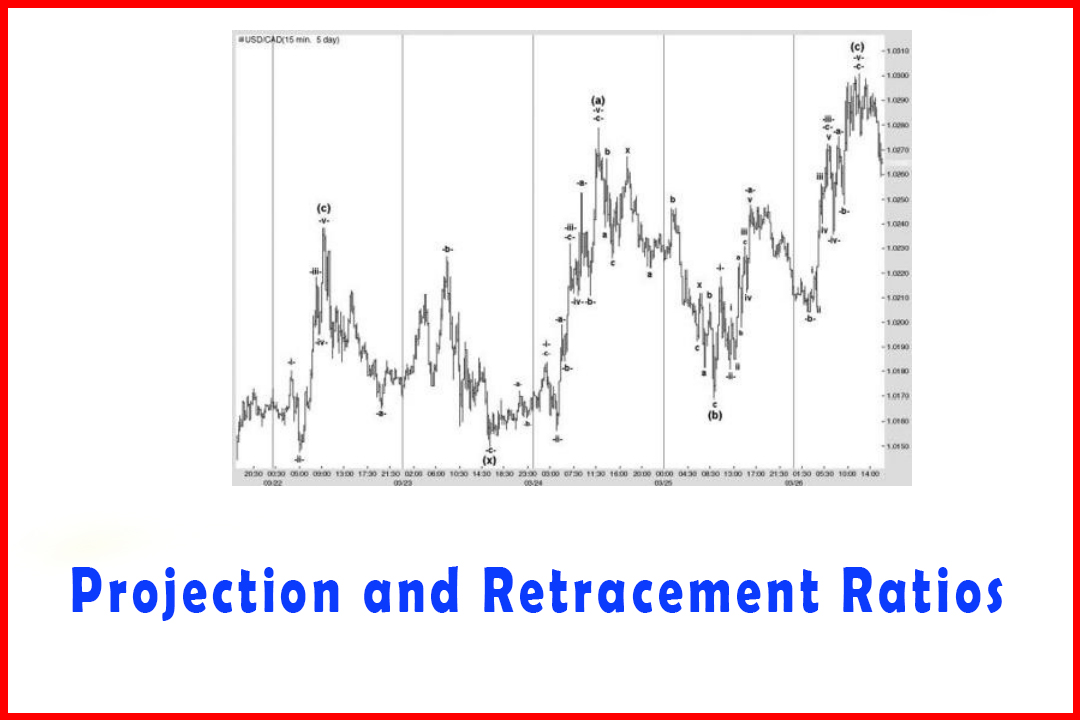
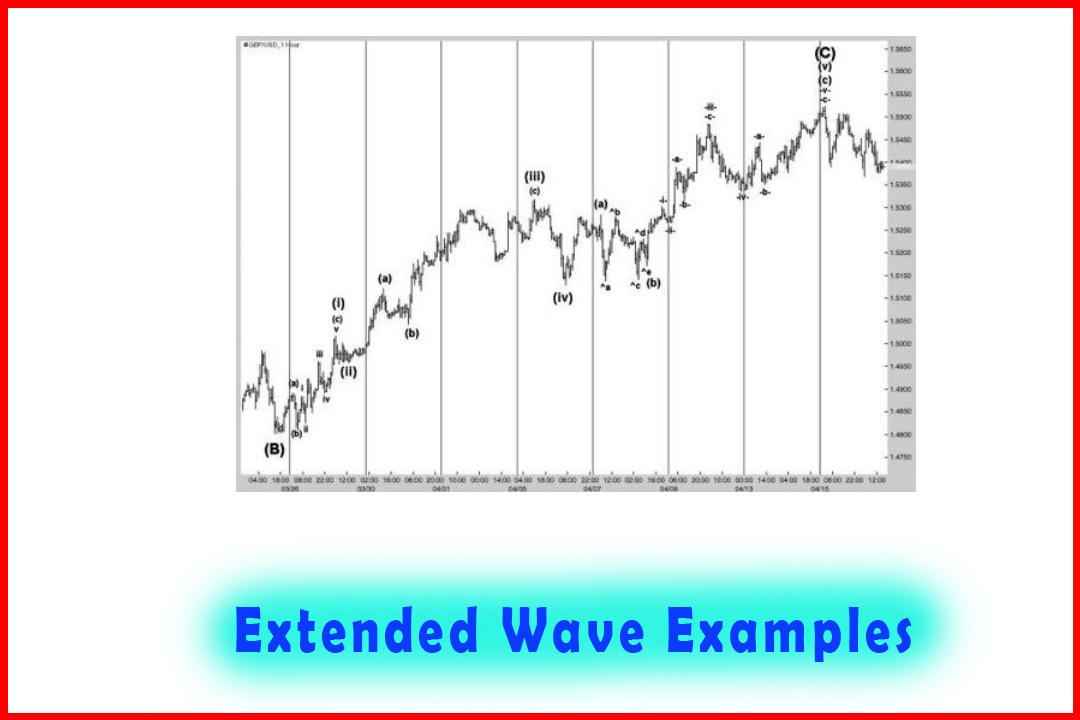
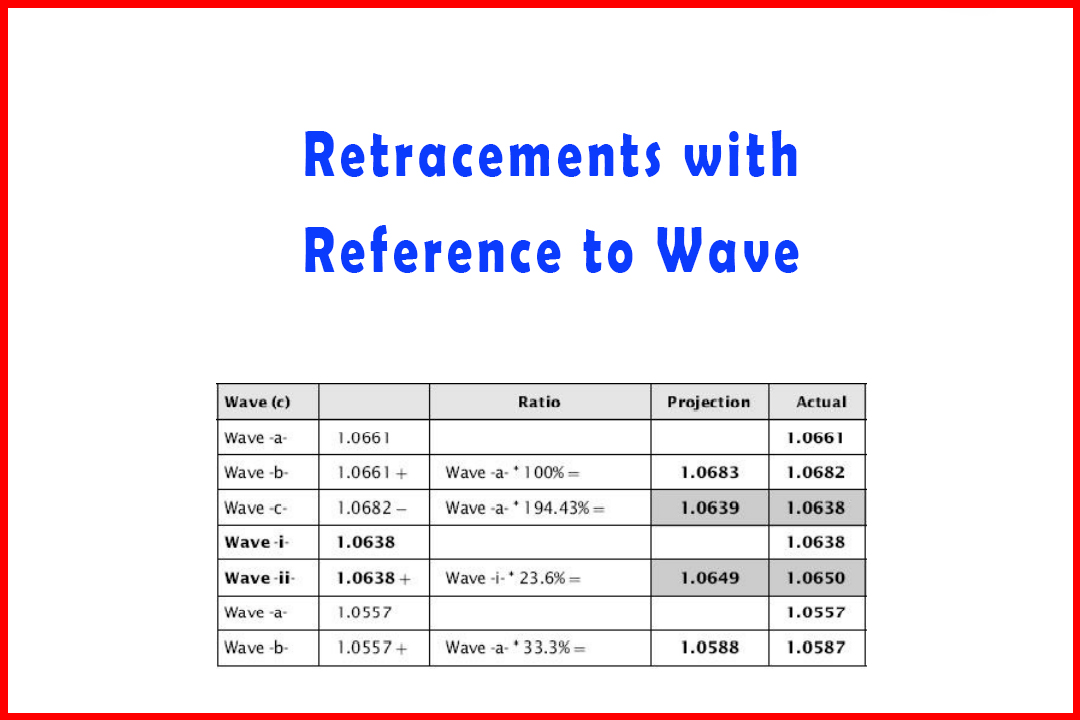
Deep Wave (x) in Wave (B) in USDCAD 15-Minute Chart
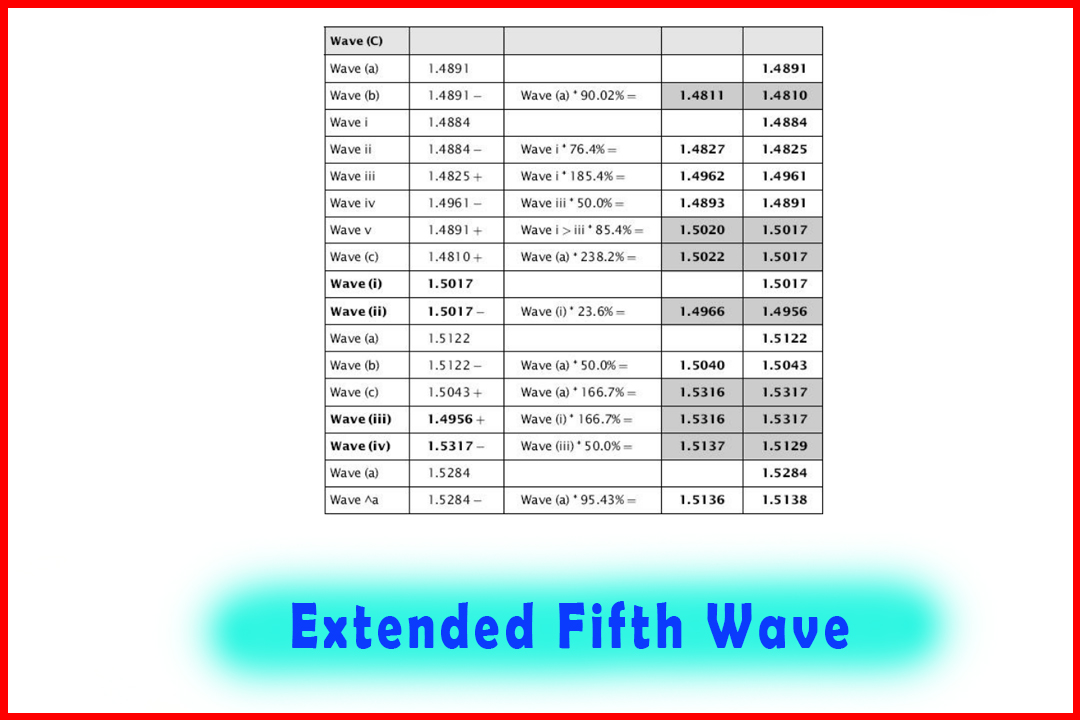
Trade retracement, Strength Harmonic Structure, Accuracy Harmonic Structure, Five wave pattern
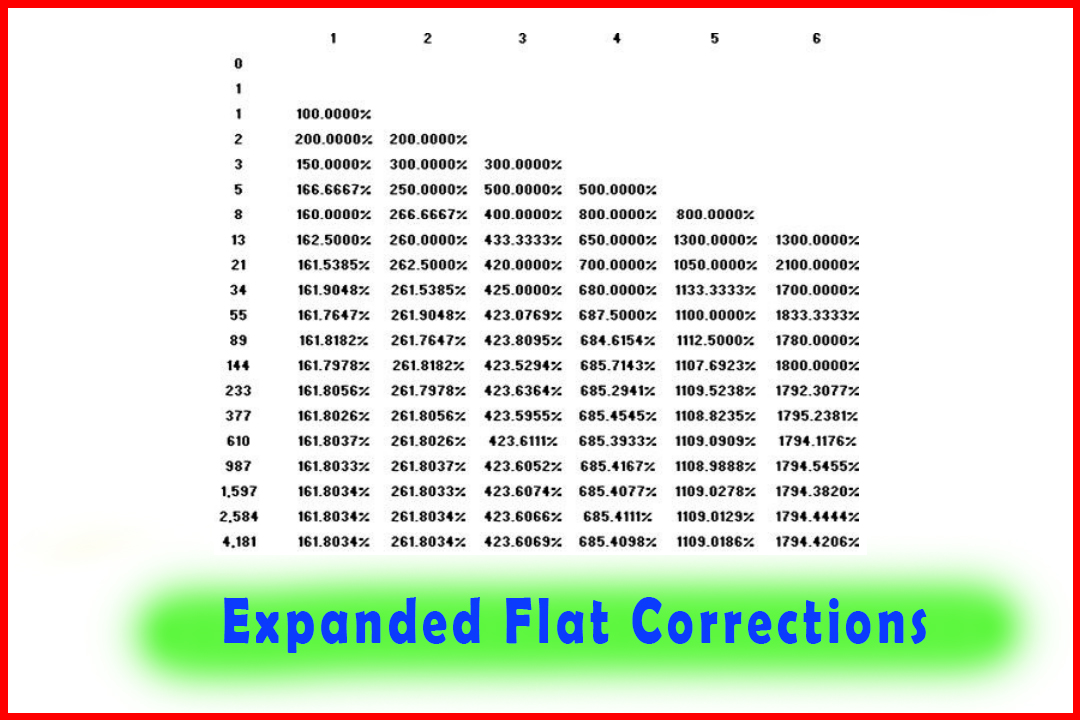
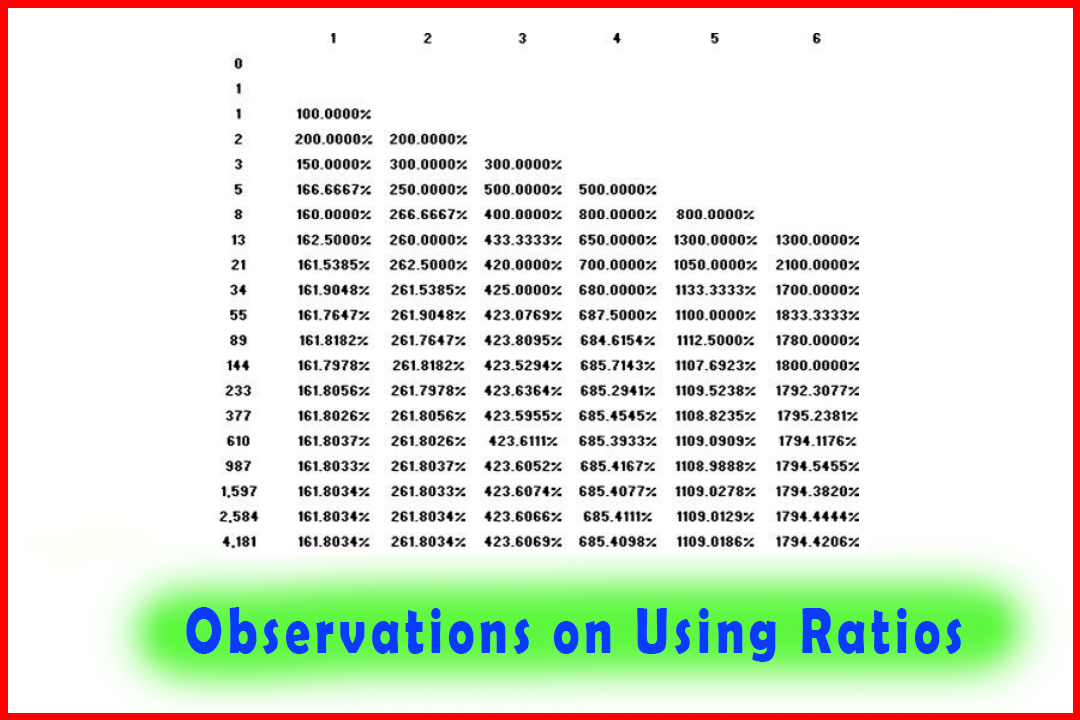
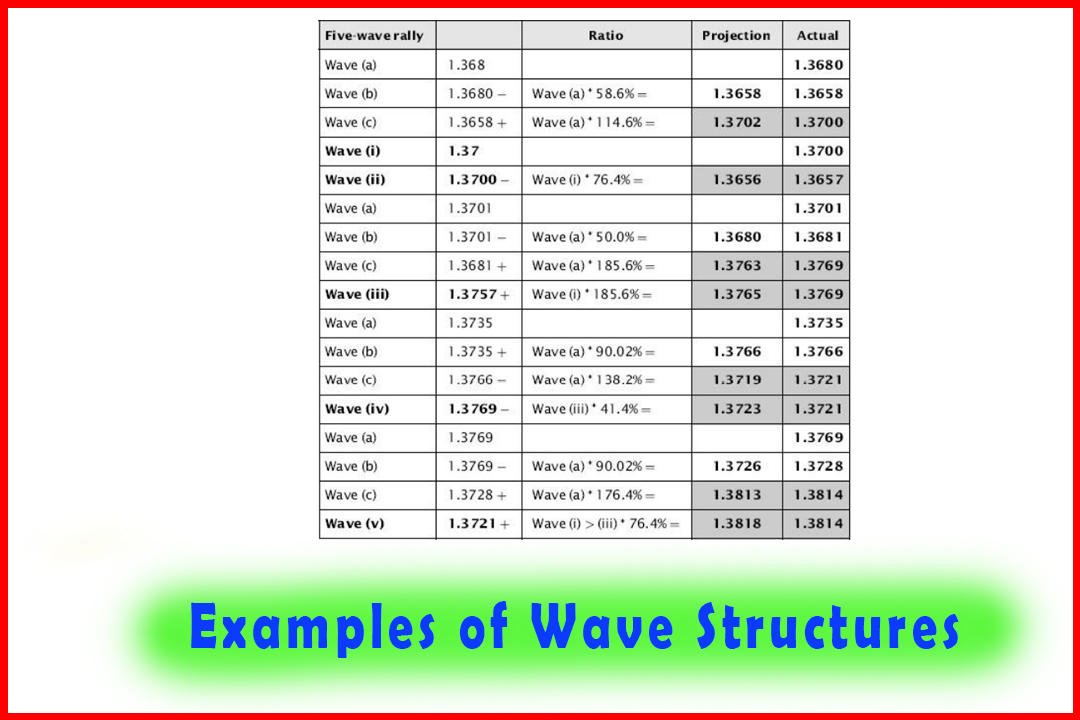
Course: [ Harmonic Elliott Wave : Chapter 4: Projection and Retracement Ratios ]
Elliott Wave | Forex | Fibonacci |
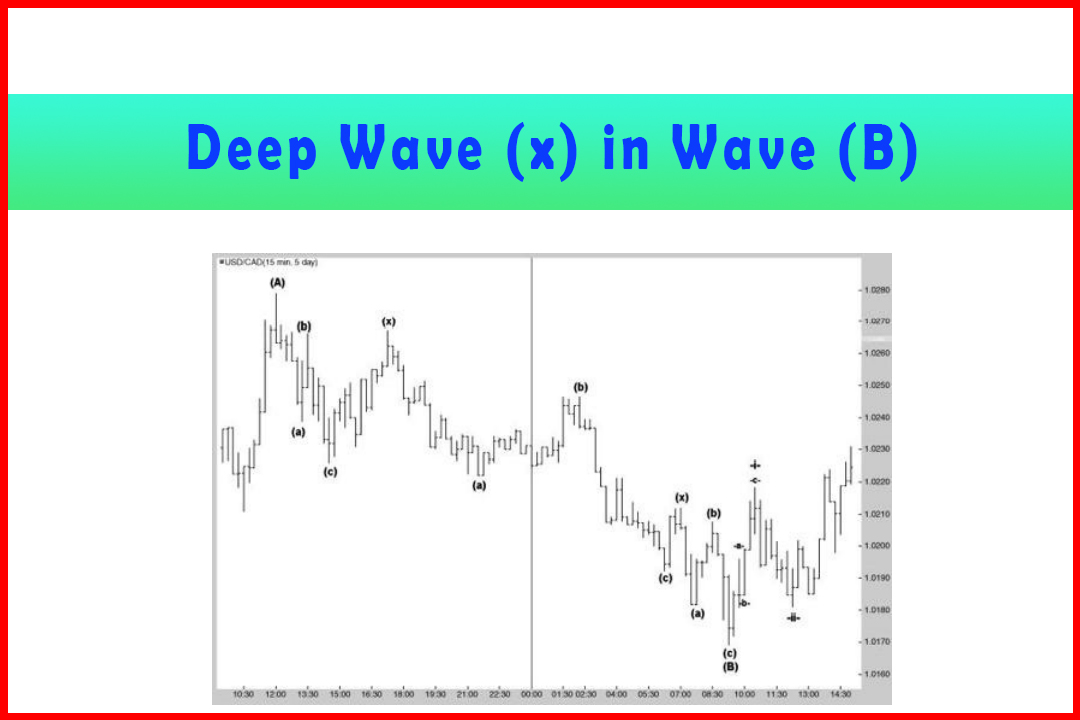
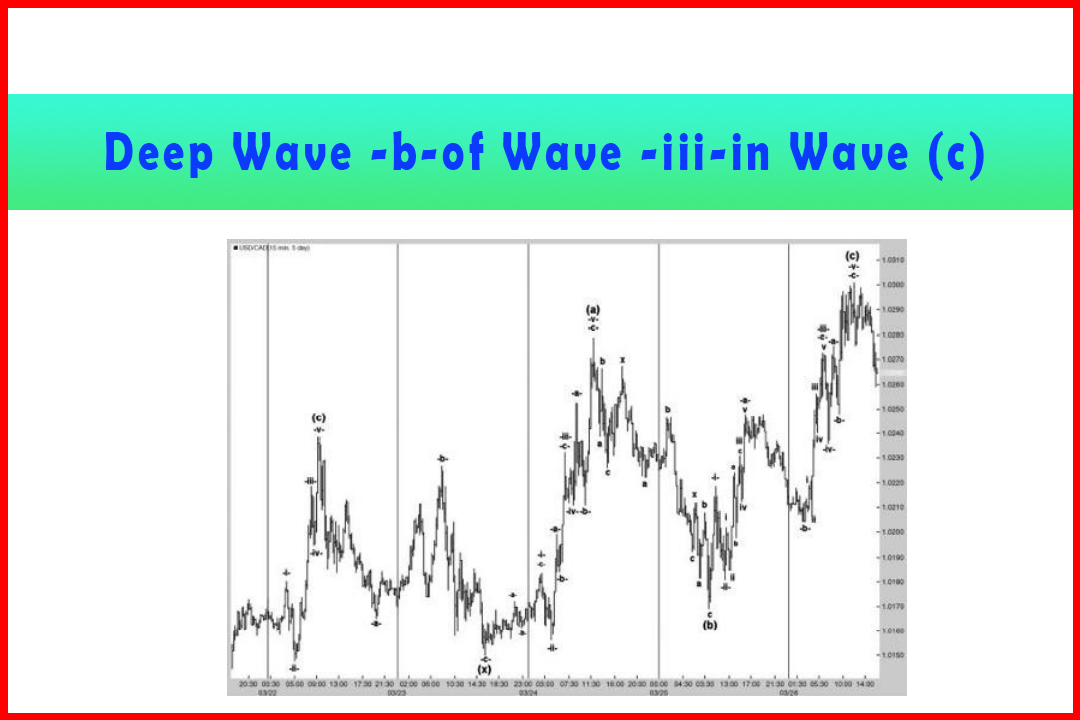
In Figure 2.8 in Chapter 2, I described the situation where a deep Wave (b) in a Triple Three can often cause a similarly deep Wave (x).
Deep Wave (x) in Wave (B) in USDCAD 15-Minute Chart
In
Figure 2.8 in Chapter 2, I described the situation where a deep Wave (b) in a
Triple Three can often cause a similarly deep Wave (x). I have reproduced the
Wave (B) pullback in Figure 4.19 to show more clearly how this develops.
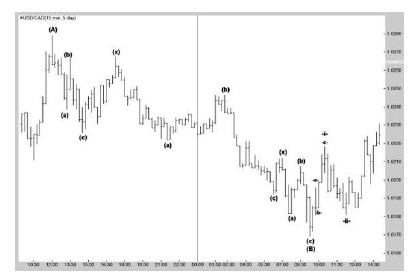
Figure 4.19 A deep
Wave (x) in a declining Wave (B) in 15-minute USDCAD
I have placed in the table displaying the wave relationships the entire Triple Three decline (Table 4.14). The first Wave (b) retraced by 66.7% and this was followed by a 76.4% retracement in Wave (x) to the same level (plus one point) at 1.0267.
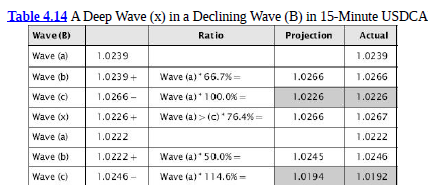
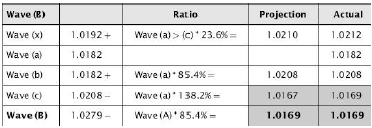
The
decline continued in two further (a)(b)(c) structures to reach a very deep Wave
(B) of 85.4% which was just 19 points above the prior Wave (x) at 1.0150.
Harmonic Elliott Wave : Chapter 4: Projection and Retracement Ratios : Tag: Elliott Wave, Forex, Fibonacci : Trade retracement, Strength Harmonic Structure, Accuracy Harmonic Structure, Five wave pattern - Deep Wave (x) in Wave (B) in USDCAD 15-Minute Chart
Elliott Wave | Forex | Fibonacci |