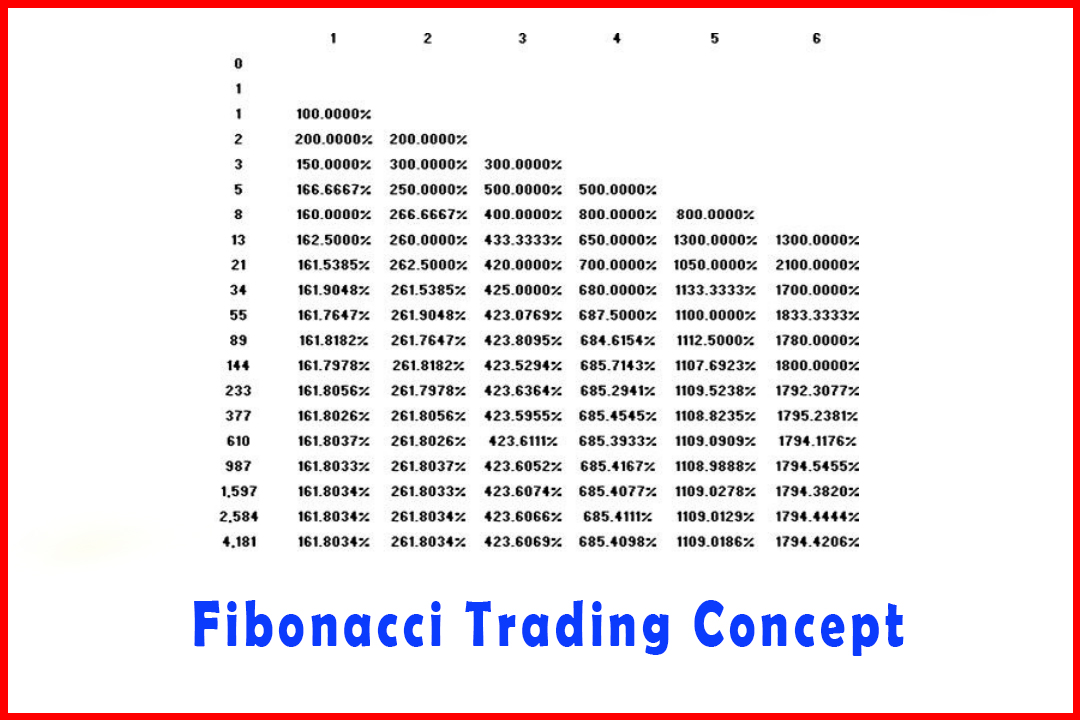
Examples of the Strength and Accuracy of the Modified Harmonic Structure
Strength Harmonic Structure, Accuracy Harmonic Structure, Five wave pattern
Course: [ Harmonic Elliott Wave : Chapter 4: Projection and Retracement Ratios ]
Elliott Wave | Forex | Fibonacci |
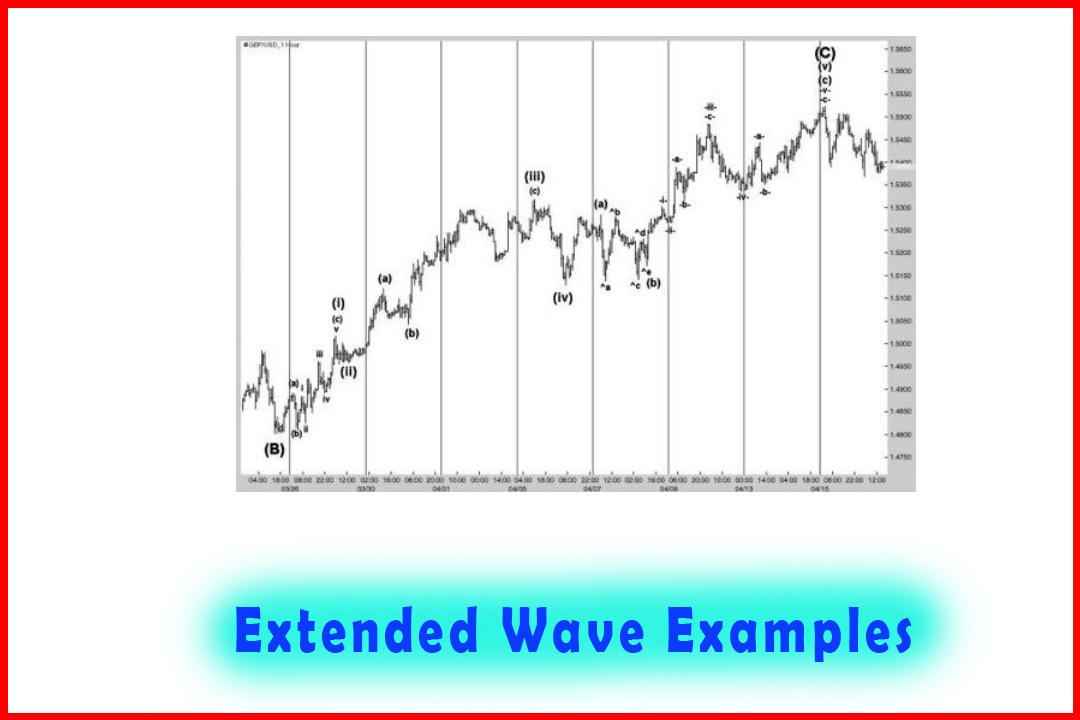
The modified structure is highlighted in the construction of Wave (a) and Wave (c), each comprising five waves but all of them in three-wave structures. In Wave-iii-of Wave
Other Examples of the Strength and Accuracy of the Modified Harmonic Structure
Next
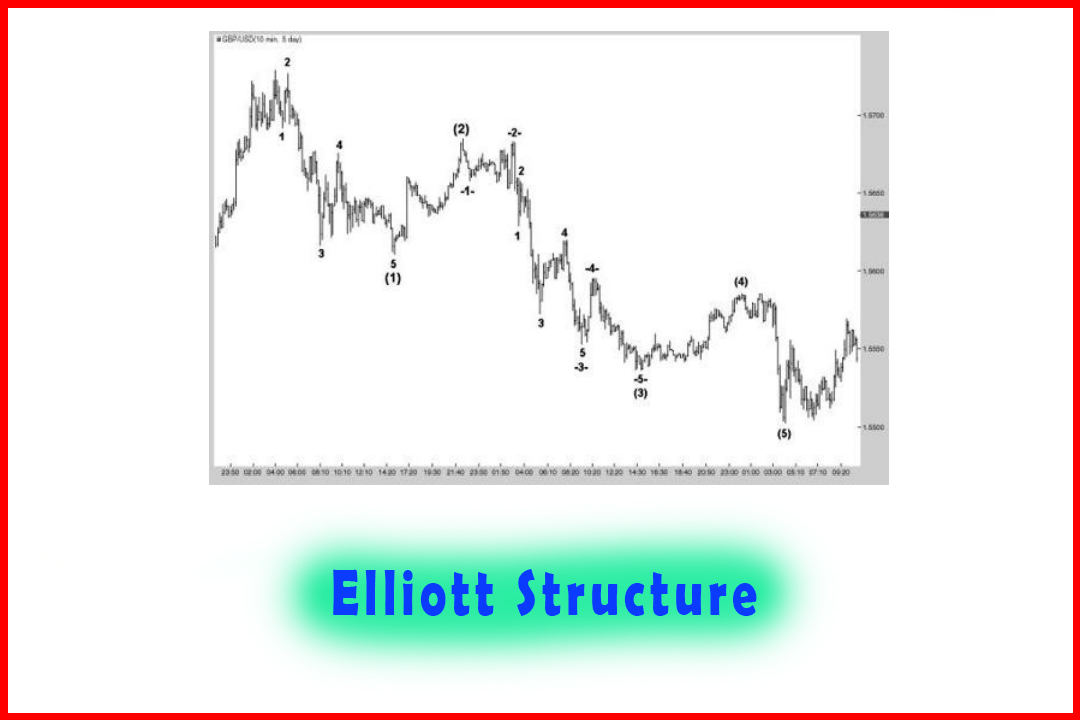
in Chapter 3, I provided the example of Figure 3.17 which displayed a Zigzag
higher in 30-minute EURUSD with an overlap in Wave [i] and Wave [iv]. I have
reproduced the image with the key price levels listed (Figure 4.14).
Figure 4.14 Zigzag
Higher in 30-Minute EURUSD with Overlap in Wave [i] and Wave [iv]
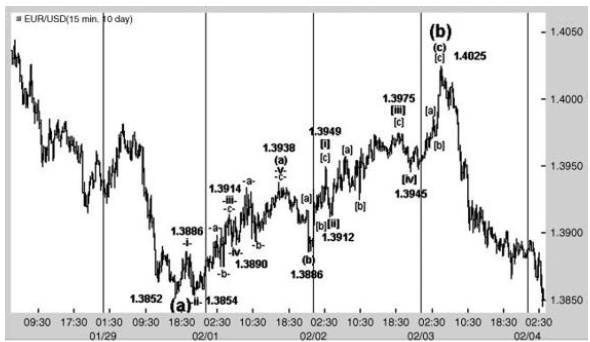
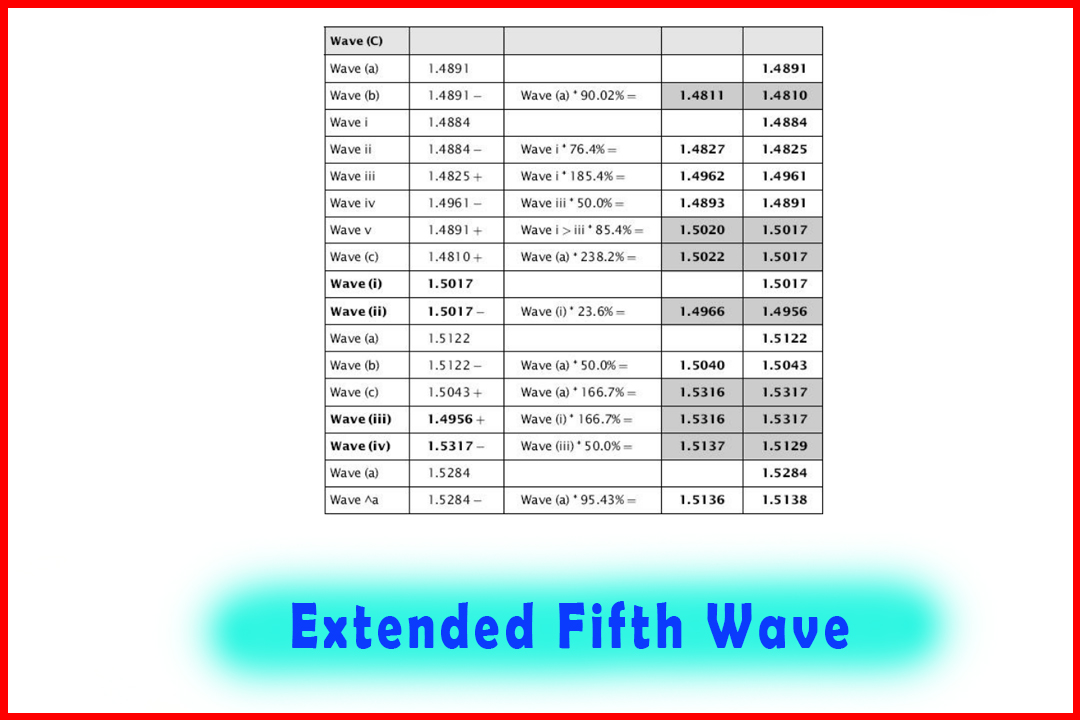
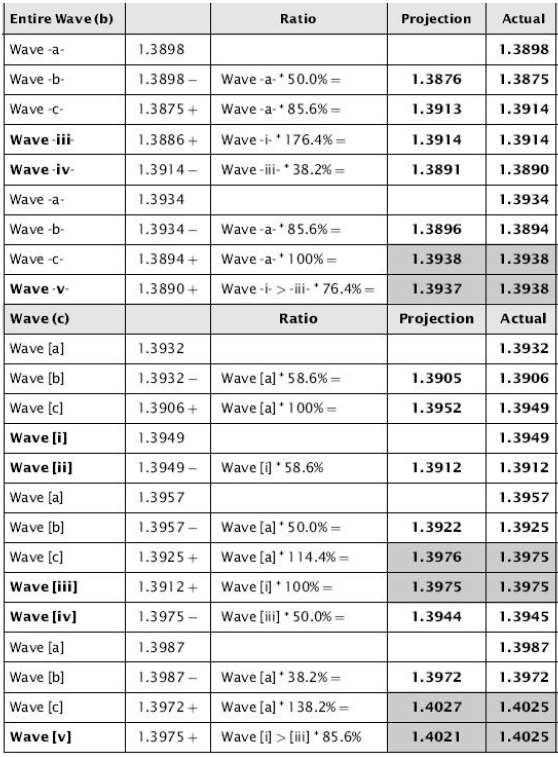
Table
4.8 displays the wave relationships for each section of the corrective rally.
Table 4.8 Wave
Relationships for the Zigzag higher in Figure 4.14
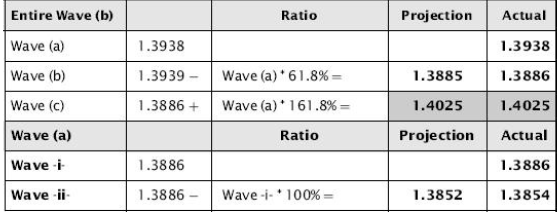
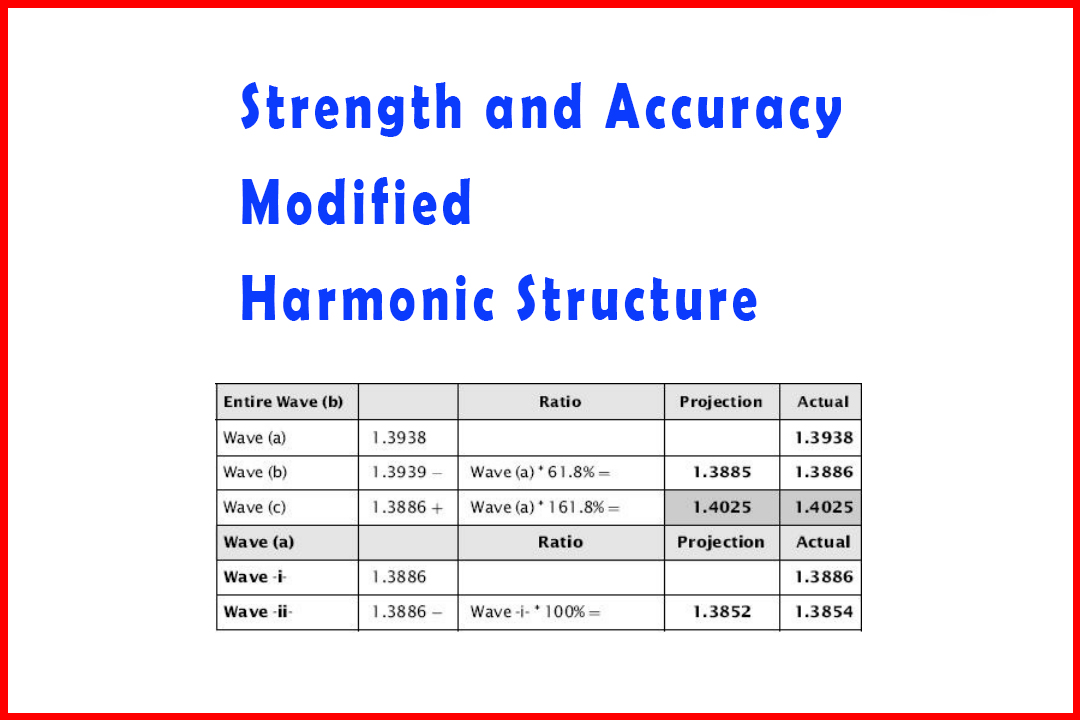
I
have separated each specific wave and listed the results. The first section is
nothing new as it merely relates to the Zigzag development in the overall Wave
(b), developing in an (a)(b)(c) move. Wave (b) was a 61.8% retracement of Wave
(a) and Wave (c) a 161.8% projection of Wave (a).
The
modified structure is highlighted in the construction of Wave (a) and Wave (c),
each comprising five waves but all of them in three-wave structures.
In
Wave -iii-of Wave (a), note that Wave-c-had a projection at 1.3914 while the
extension in Wave -iii-was the common 176.4% projection of Wave -i-. Given Wave
-ii-was just about a 100% retracement of Wave-i-we can see that Wave-iv-was a
shallow 38.2%. This gave rise to a 76.4% projection in Wave -v- to the same
target as a wave equality projection of Wave -a-in Wave-c-.
In
Wave (c) it can be seen that a similar process provided remarkably accurate
targets in Wave [c] of Wave [iii] and the extension of Wave [i], which turned
out to be a wave equality target with Wave [i]. Similarly the targets for Wave
[c] of Wave [v] and Wave [v] itself were within six points.
This
larger Wave (b) was actually a deep Wave (b) of a declining Wave (iii) which
retraced an exact 66.7% of Wave (a).
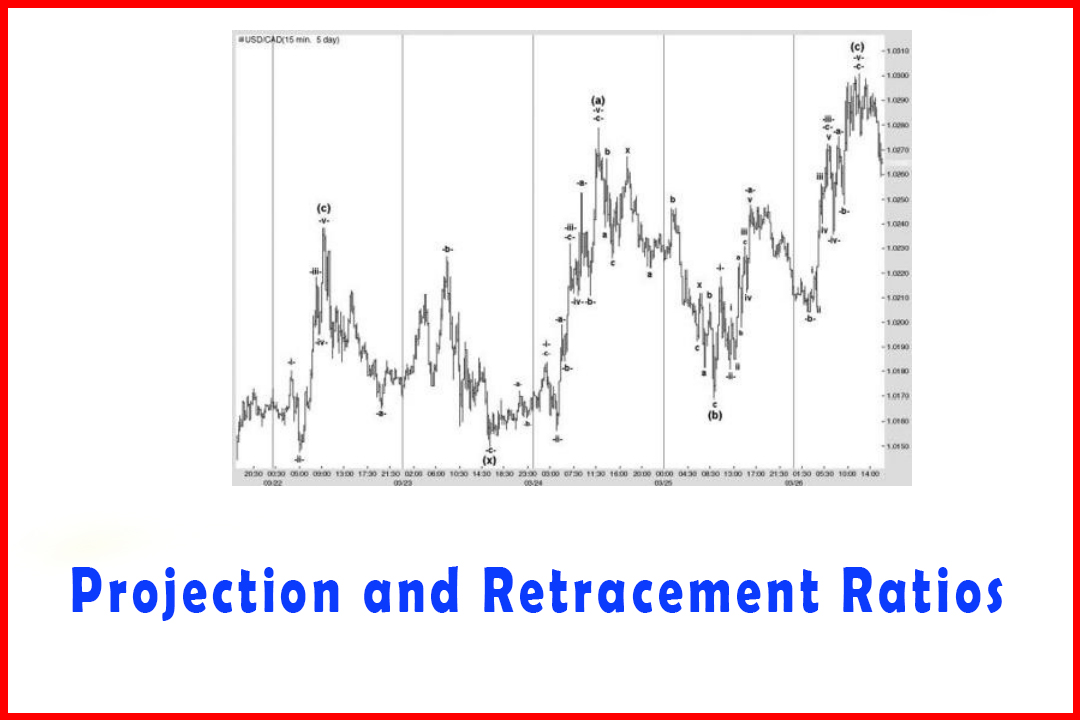
In
another example in Chapter 3 I offered the five-wave decline in Wave efc in
USDCAD (as shown in Figure 4.15).
Figure 4.15 A
Decline in Wave efc in 10-minute USDCAD to Complete what was a Wave (iv)
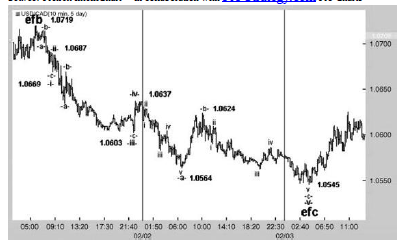
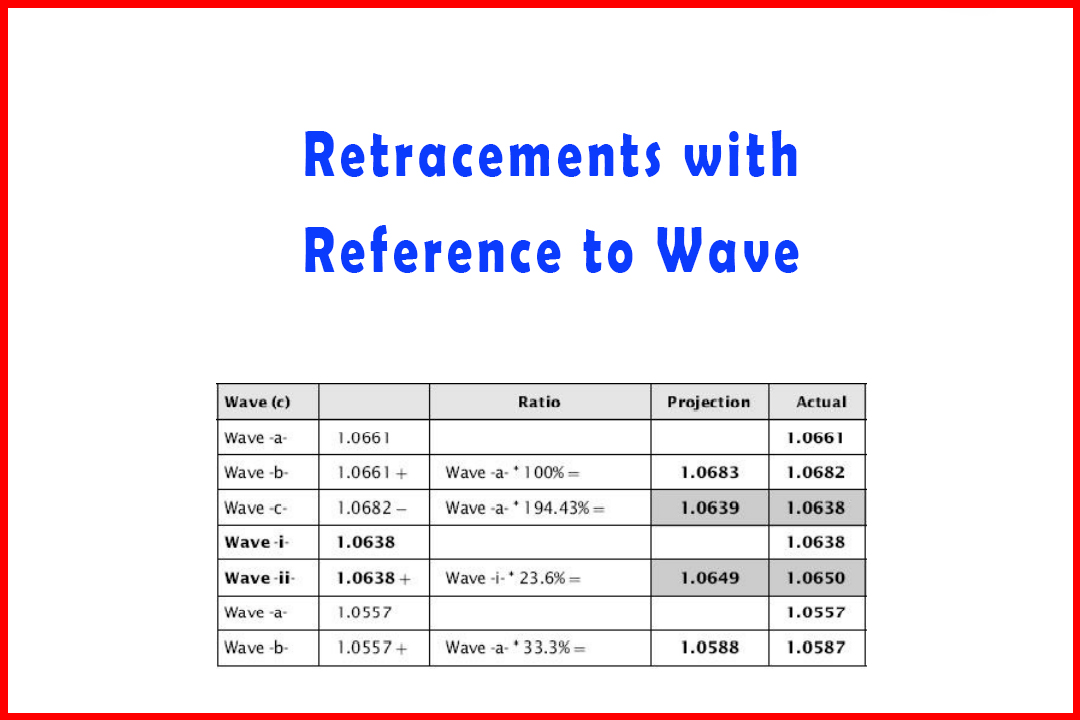
Table 4.9 shows the table of the individual waves that constructed the decline


Here
I have separated each of the impulsive waves and also the breakdown of Wave
-a-and Wave -c-of Wave -v-.
The
modified structure in this example is remarkably accurate, with the majority of
individual wave targets matching the internal abc waves to within one point.
Only in the final Wave -c-of Wave -v-was there a difference of six points, but
then the Wave v of Wave -c-did have a 66.7% projection that matched the 66.7%
Wave -v-projection at 1.0545. All waves adhered to the normal ratios seen in
the modified wave structure.
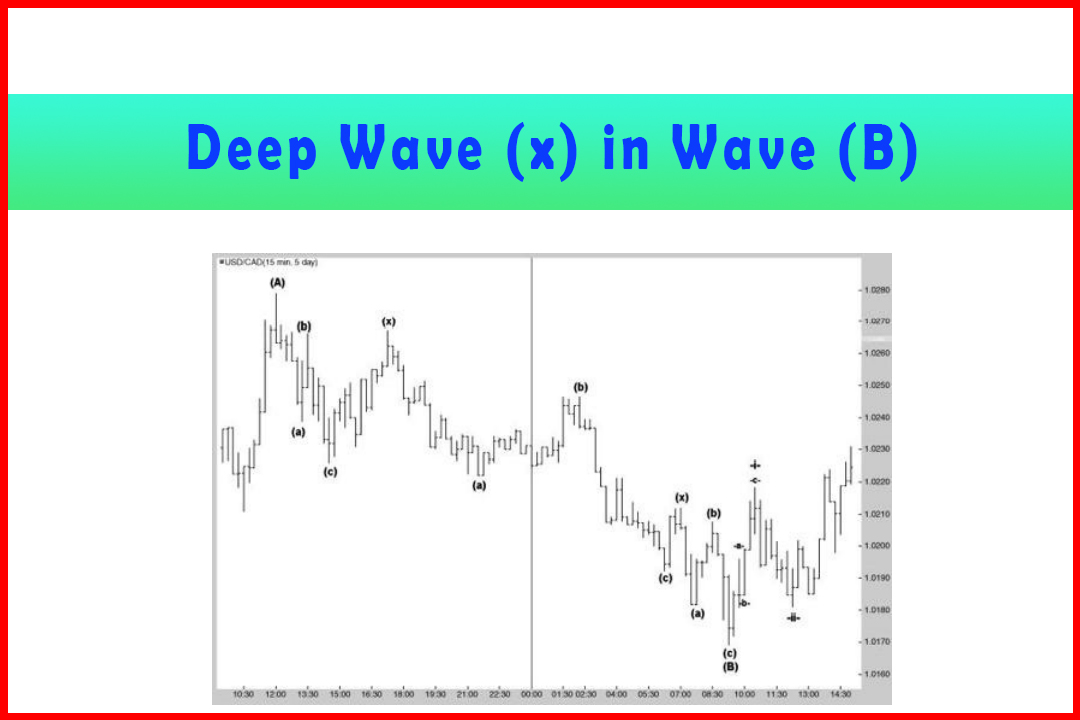
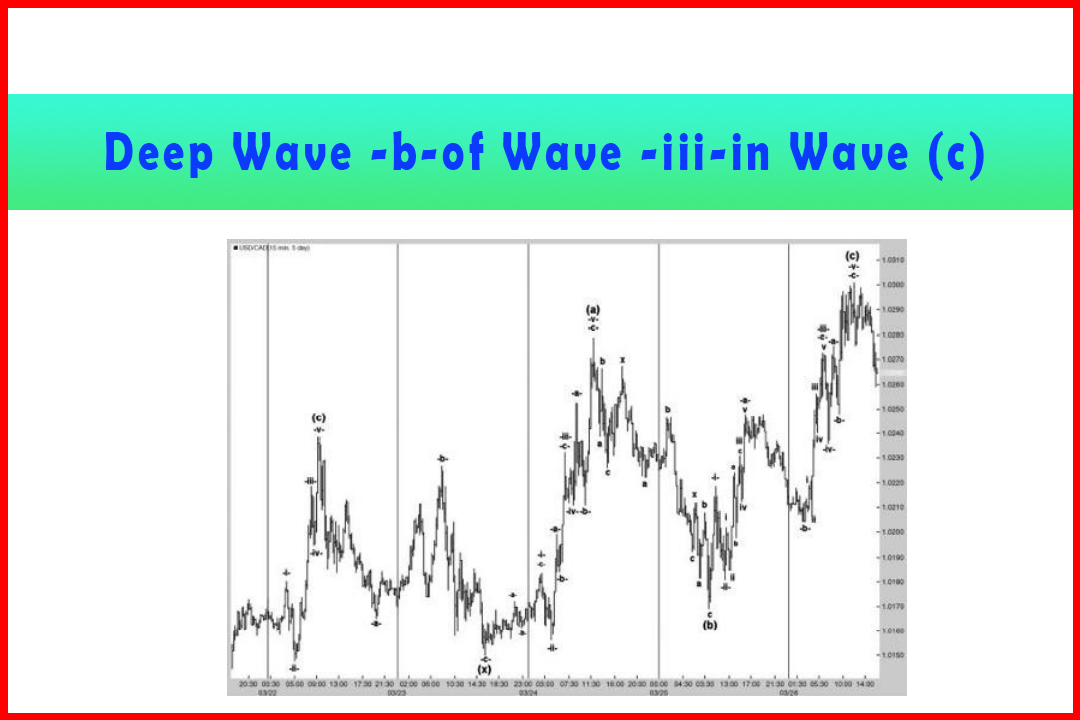
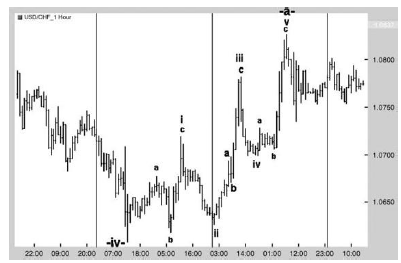
As
a third example, in Figure 4.16. I have taken the deep Wave -b-of Wave - iii-that
was shown in Figure 3.21 in the hourly USDCHF market.
Figure 4.16 An
(A)(B)(C) with a Deep Wave-b-in Wave -iii-in Hourly USDCHF
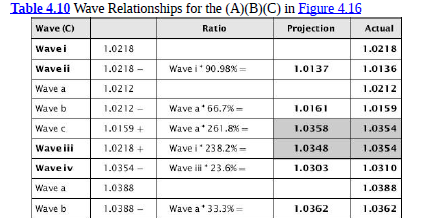
Table
4.10 shows the individual waves that constructed the rally.
In
Wave (A) we had a standard five-wave move in which Wave (v) ended midway
between the 76.4% and 85.4% projections. The retracement in Wave (B) was just
over 33.3%.
After
seeing the pullback in Wave (B), we would be looking for a rally in Wave (C)
and thus we should be concentrating on normal projections generated from Wave
(A). These produced potential targets at:
100.0%
= 1.0732
114.6%
= 1.0785
138.2%
= 1.0872
161.8%
= 1.0958
Table
4.11 displays the relationship in Wave (C).
Table 4.11 Wave Relationships for the Wave (C) Rally in Figure 4.16
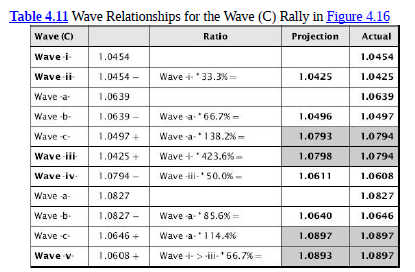
Here
I am concentrating on the rally from the 1.0366 Wave (B) low until the
completion of Wave (C) at 1.0897. In terms of projections of Wave (A), the final
1.0897 high was not particularly accurate, which disappoints. However, the Wave
-v-projection of 66.7% came within three points and the 114.6% projection in
Wave -c-of Wave-v- was actually perfect.
Once
again, the rally in Wave (C) was fueled by common wave ratios. Note the
relatively shallow 33.3% retracement in Wave -ii-that spurred a deeper Wave
-b-of Wave -iii-that was the very common 66.7% retracement. In addition the
138.2% projection in Wave -and the 423.6% projection of Wave -i-, both
arrived at the same area with only four points of variance.
In
this case, the Wave -iv-was probably deeper than would normally be expected at
50% and this would have had to have been managed by observing the nature and
structure of the decline in the five-minute chart.
The
66.7% projection in Wave -v-and the 114.4% projection in Wave -c-also matched
with a variance of four points.
I
should add at this point that the 85.6% and 114.4% projections in Wave–c-are
surprisingly common. I can only imagine that there is a common observation that
wave equality relationships occur quite frequently and the slightly shorter and
slightly longer are reflections of early profit taking and stop losses being
triggered from reversal positions at the wave equality target respectively.
However, from the analyst's perspective, what we are looking for are
matching targets drawn from both the larger projection of Wave -a-and the
internal Wave v of Wave -c-.
In
Figure 3.22, I also covered the rather unusual structure in Wave -a-of Wave
-v-. Therefore, we should also take a closer look at the internal structure and
wave relationships (as shown in Figure 4.17).
Figure 4.17
Internal Structure of Wave -a-of Wave -v-Higher in USDCHF
The related table of wave relationships is shown in Table 4.12.
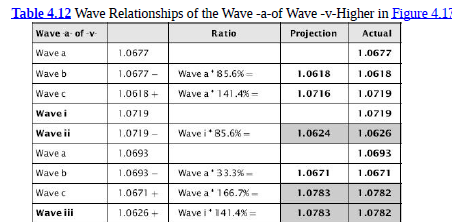
This
type of price development is not the easiest to forecast due to the number of
less common wave relationships. An 85.6% retracement in Wave b (of Wave i) must
always be one of the areas to watch out for, but it can begin to cause some
doubts when approached. The 141.4% projection in Wave c is not one I'd
usually look for, but since this is an hourly chart the wave development in the
five-minute chart should have provided some indication. The 85.6% retracement
in Wave ii would have again raised some doubts but the key was the fact the
Wave b low was not breached.
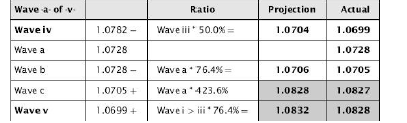
Given
that both Wave b and Wave ii were exceptionally deep, the guideline of
alternation would warn that Wave b may well be short and shallow. Indeed it
was, and then Wave c of Wave iii extended by 166.7% which again is less
frequently seen. To have it match again with a 141.4% extension of Wave i is
not high on the list of common projections.
Even
after a 50% retracement in Wave iv the 76.4% projection in Wave v is very
common, but the 423.6% projection in Wave c is not.
Harmonic Elliott Wave : Chapter 4: Projection and Retracement Ratios : Tag: Elliott Wave, Forex, Fibonacci : Strength Harmonic Structure, Accuracy Harmonic Structure, Five wave pattern - Examples of the Strength and Accuracy of the Modified Harmonic Structure
Elliott Wave | Forex | Fibonacci |