Extended Wave Examples
Extended Wave Trading Strategy, Harmonic wave, Fibonacci ratios, harmonic structure
Course: [ Harmonic Elliott Wave : Chapter 4: Projection and Retracement Ratios ]
Elliott Wave | Forex | Fibonacci |
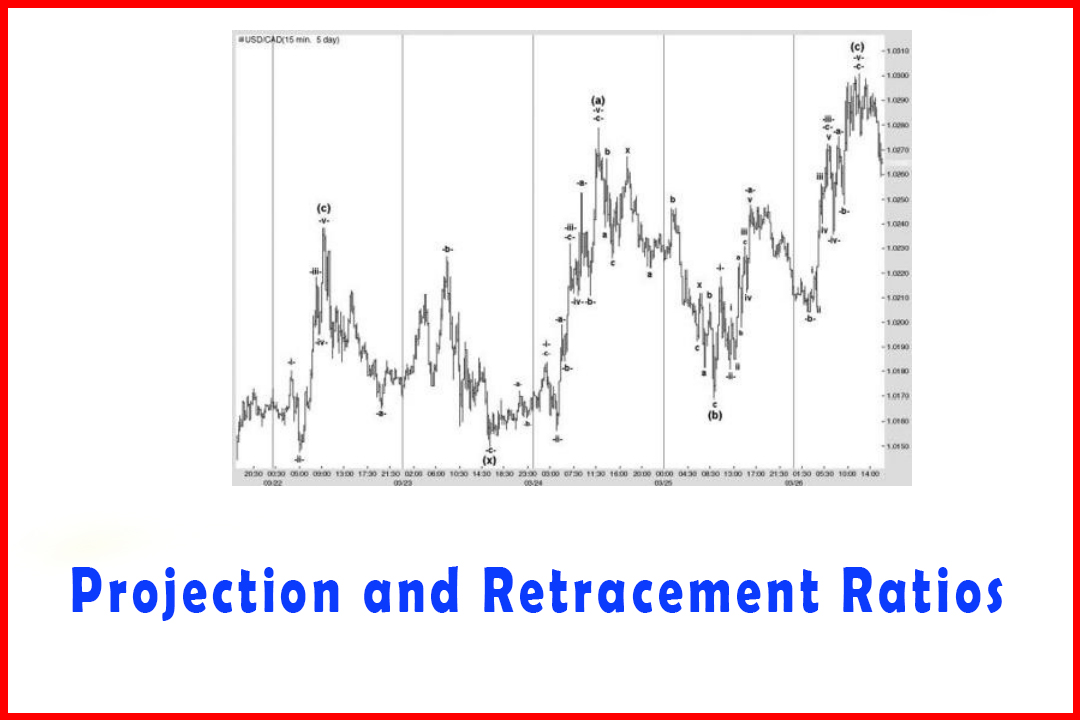
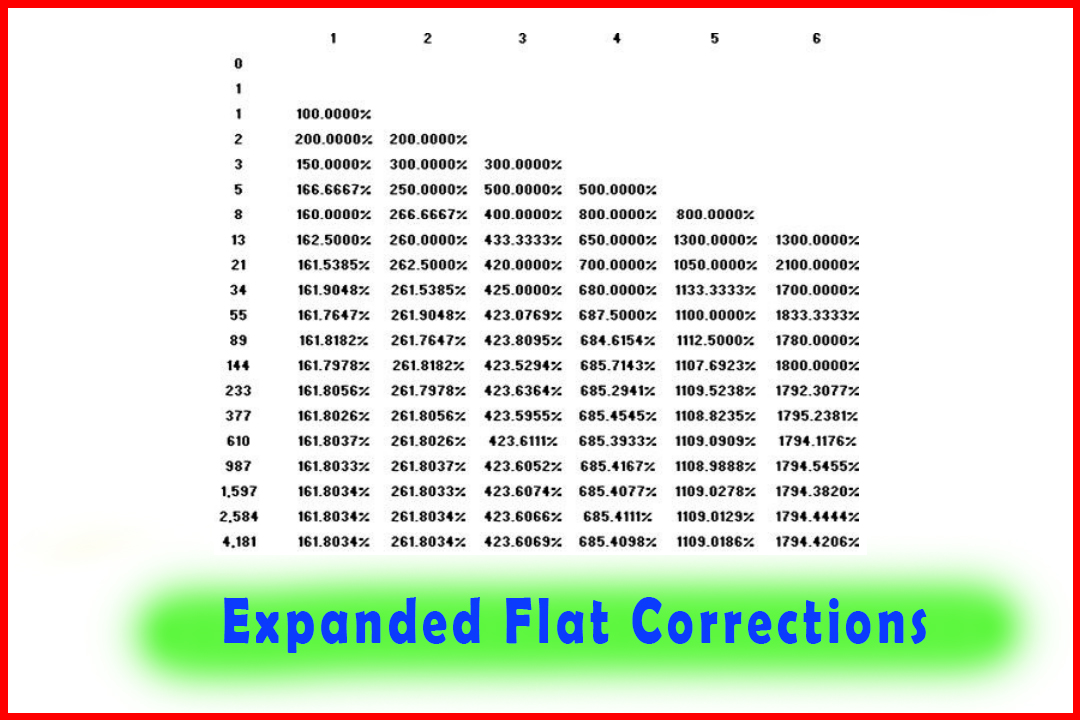
The extremely close correlations of the key waves are highlighted, with all projections and retracements being linked to Fibonacci ratios.
Extended Wave
Examples
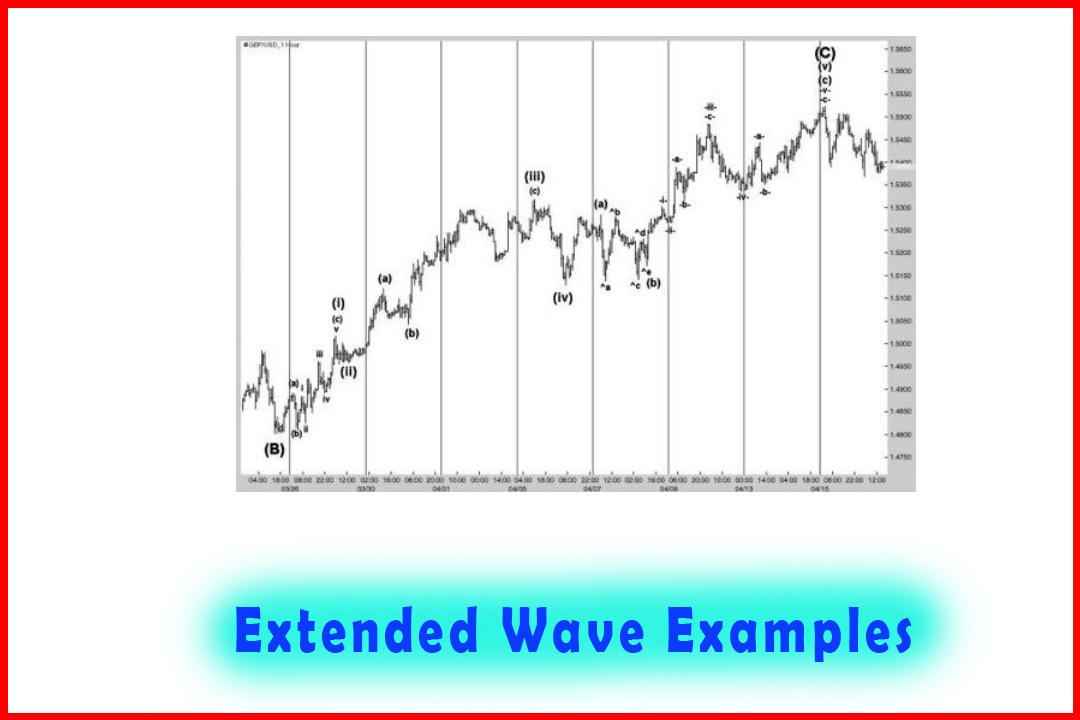
In
Chapter 3, I covered examples of how Elliott's extended wave appears
to be a misjudgment of the real underlying harmonic structure. In Figure 3.8 I
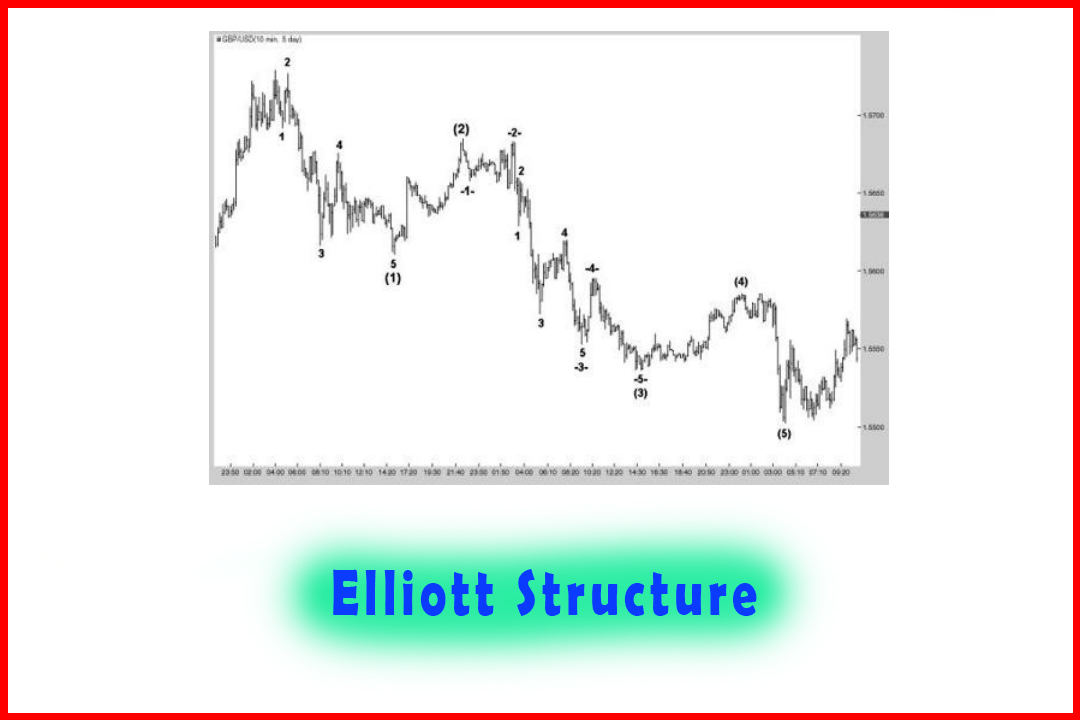
provided the example of a rally in GBPUSD and provided the harmonic wave count
(shown in Figure 4.7).
Figure 4.7 A
Five-Wave Rally in the Hourly GBPUSD Market
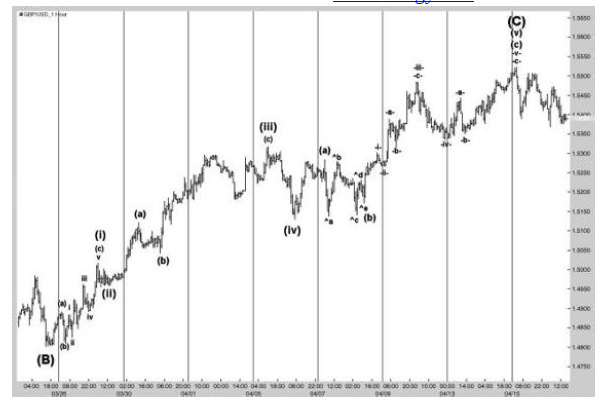
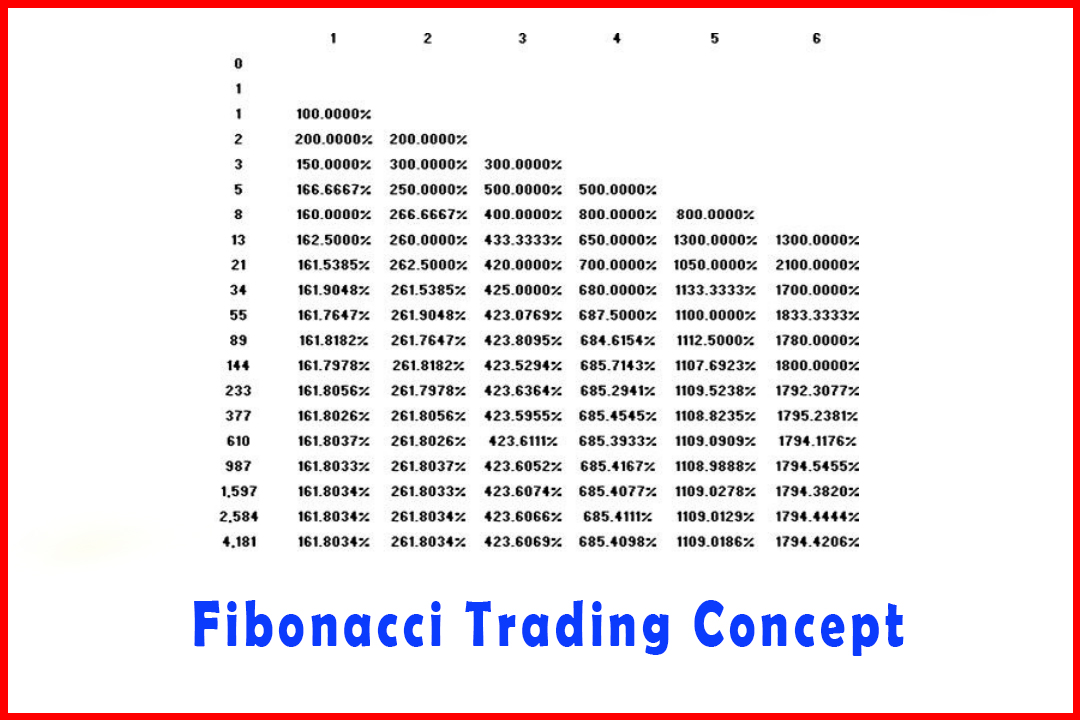
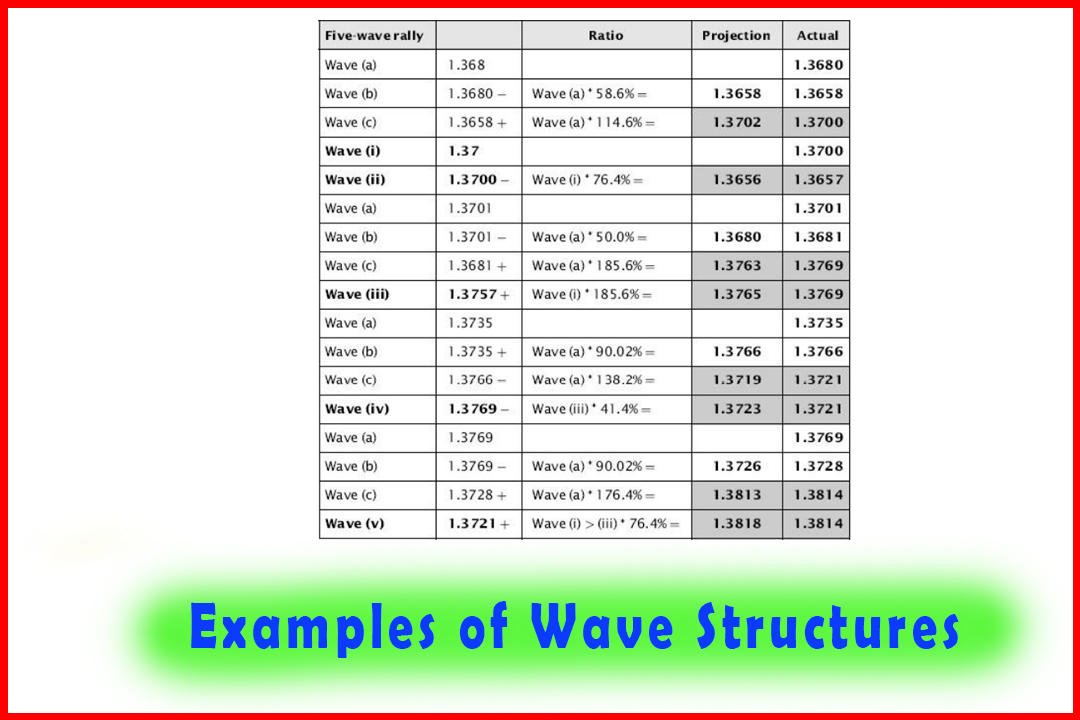
Table 4.2
provides the ratios in all waves.
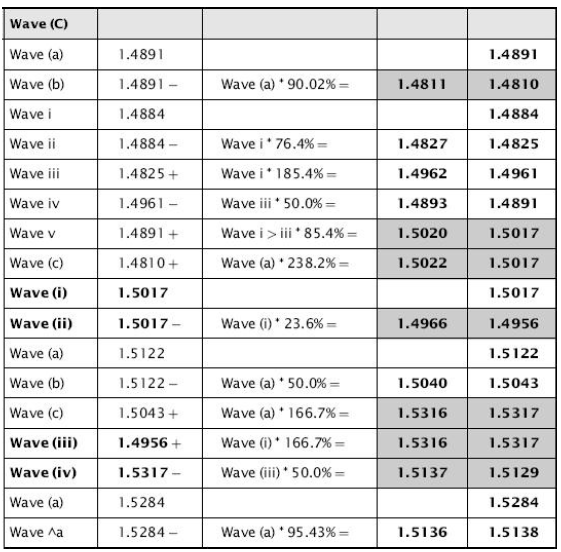
The
extremely close correlations of the key waves are highlighted, with all
projections and retracements being linked to Fibonacci ratios. Such ratios can
provide extremely precise targets, or if the structure has been complex then
identification of exactly what has occurred once that part of the structure has
been completed. Above all, it generates more confidence in understanding each
section of the structure and leaves fewer instances where subjective judgment
needs to be applied.
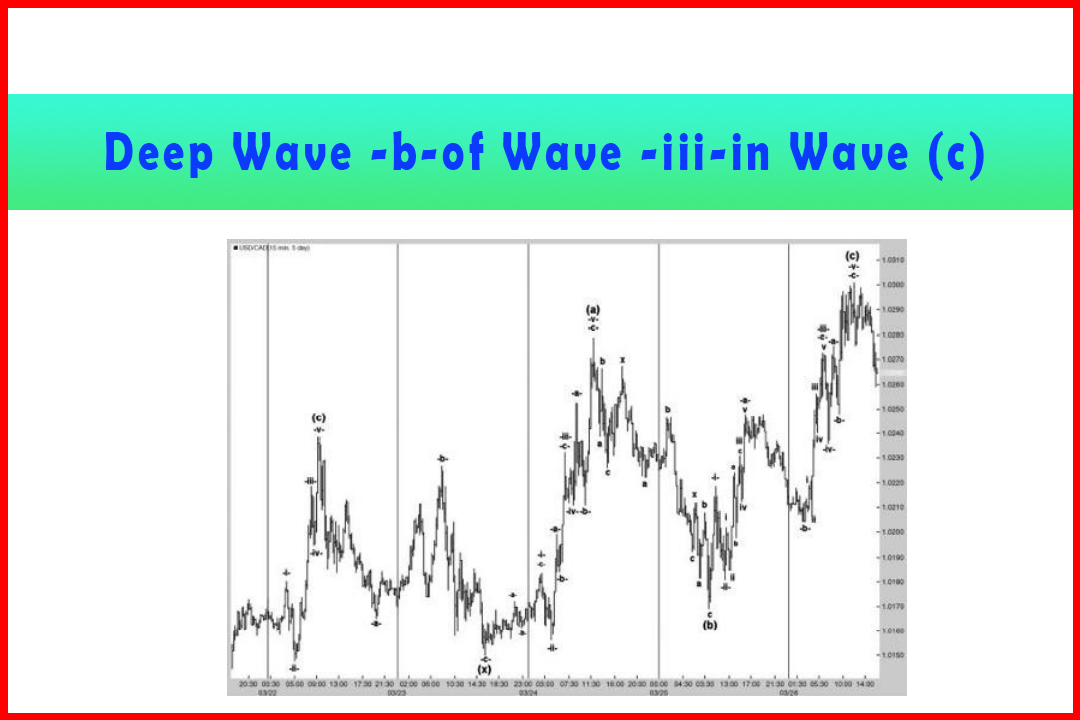
Also
in Chapter 3 I provided an example of a harmonic version of a stronger extended
wave (shown in Figure 4.8).
Figure 4.8 A
Five-Wave Decline with a Strong Extended Wave -iii-in Five- Minute USDCHF
Market
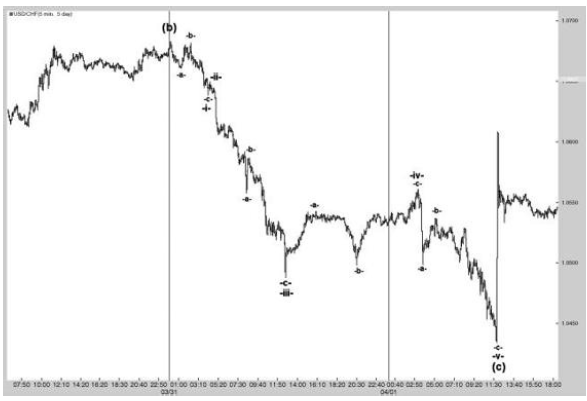
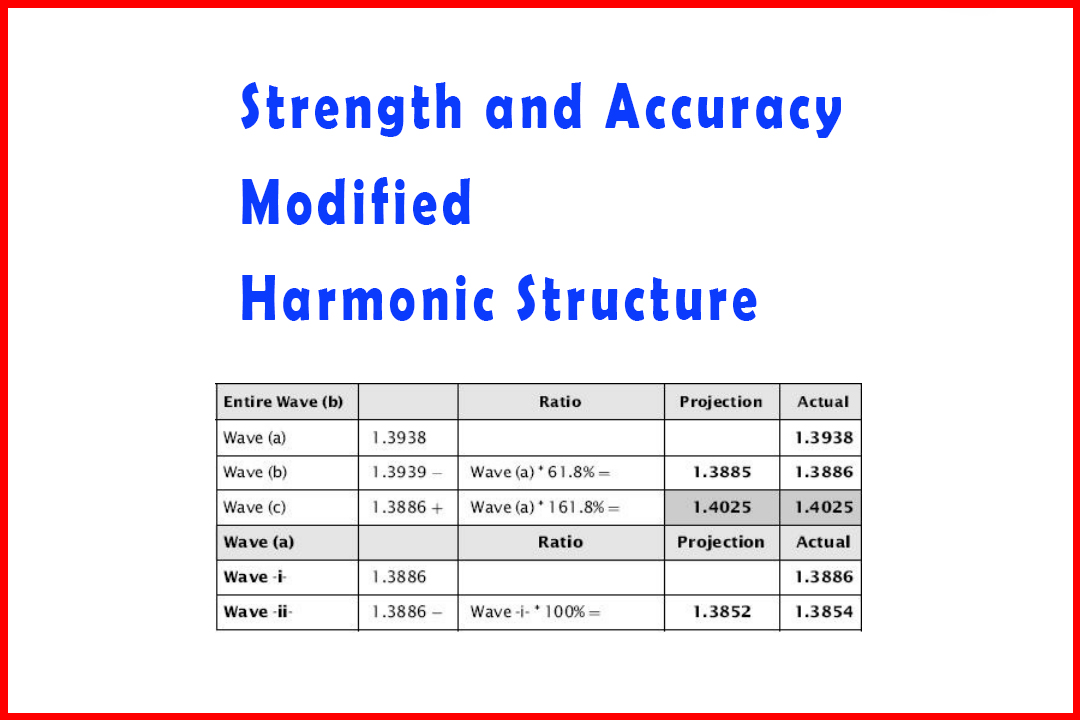
In
this example the wave relationships are exceptionally accurate (as shown in
TableAB). It is very important to note how the internal ABC relationships
confirm the projections of Waves -i-through Wave -v-. In addition, while not
shown, the end of Wave (c) at 1.0434 should also be a close relationship with
that of Wave (a).
Table 4.3 Wave
Relationships for the Five-Wave in Figure 4.8
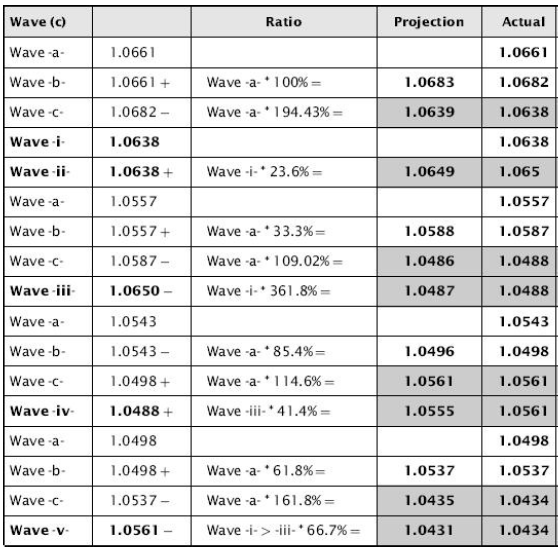
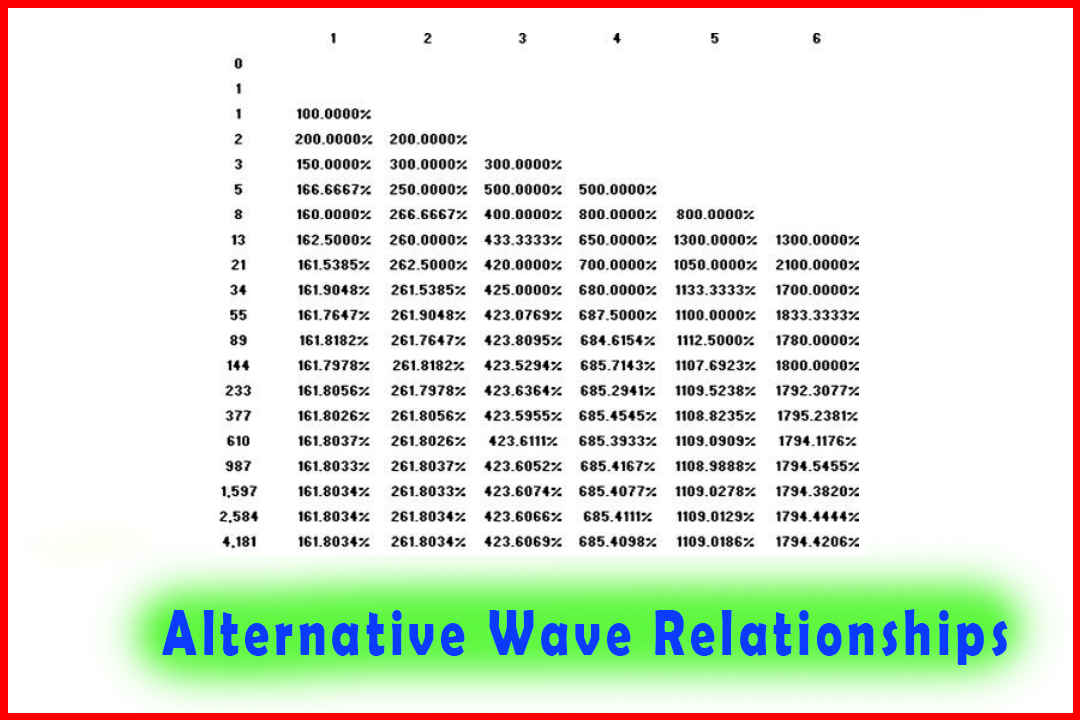
These
fractal relationships across the entire wave structure of all degrees is very
noticeable and, in my mind, is conclusive proof that R. N. Elliott (probably
quite understandably) made an error of judgment when defining the five-wave
impulsive structure.
As
a second example of a clearly extending Wave (iii), in Chapter 3, I offered the
hourly chart of a decline in Wave (c) in what I considered then to be Wave
(iii).
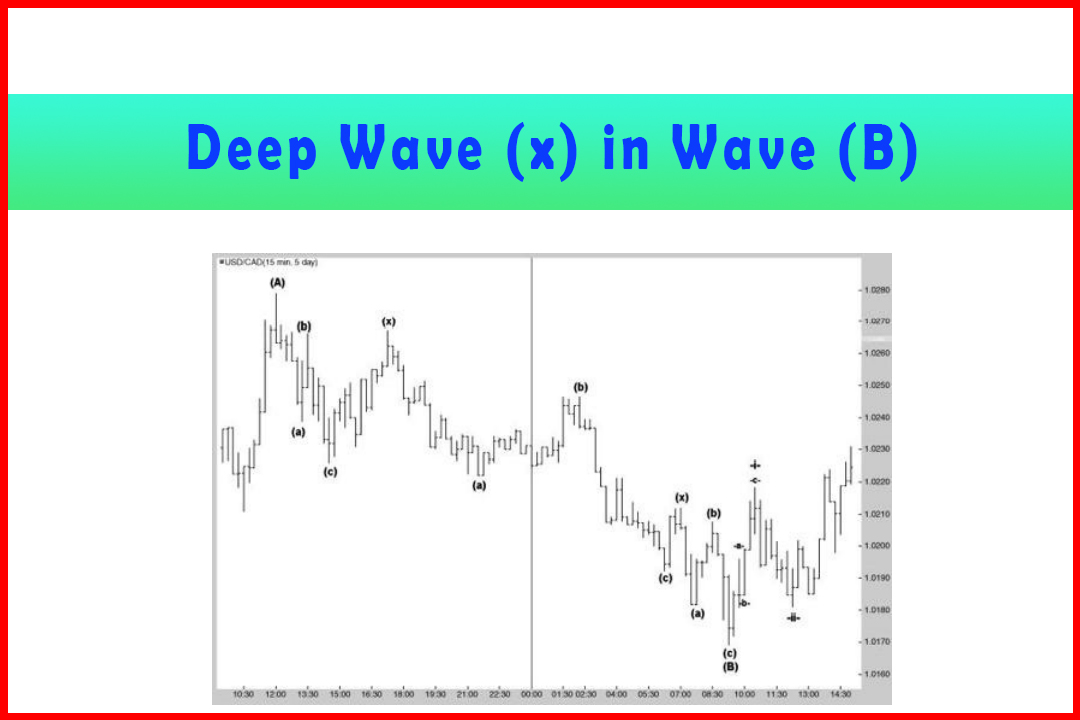
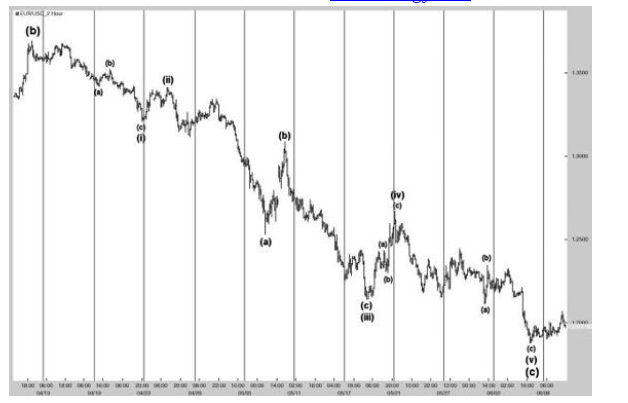
Figure
4.9 displays the same chart as provided in Chapter 3 as an example of an
extended wave and also one with a deep Wave (b). The key to identifying the
harmonic structure is in synthesizing the different fractal elements of the
entire wave. Each impulsive wave must have a projection in Wave (c) that is a
normal ratio of Wave (a). Waves (iii) and (v) must in addition have targets
from extensions of Wave (i) and Wave (i) to (iii) respectively.
Figure 4.9 A Five-Wave Decline in Hourly EURUSD with an Effective Extended Wave (iii)
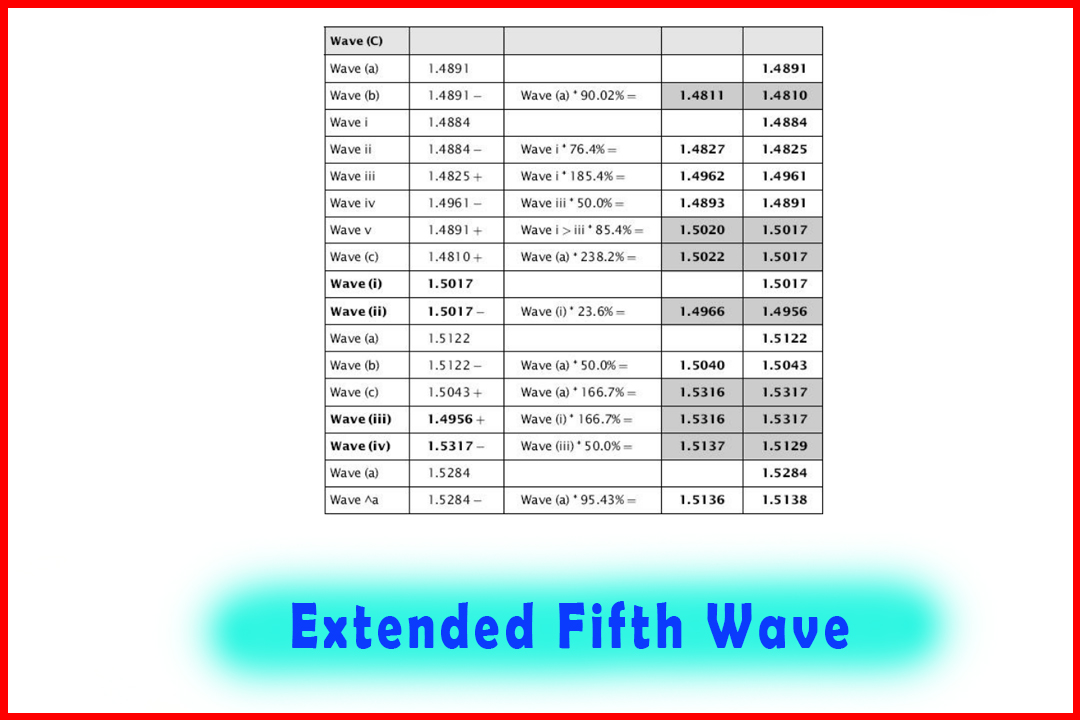
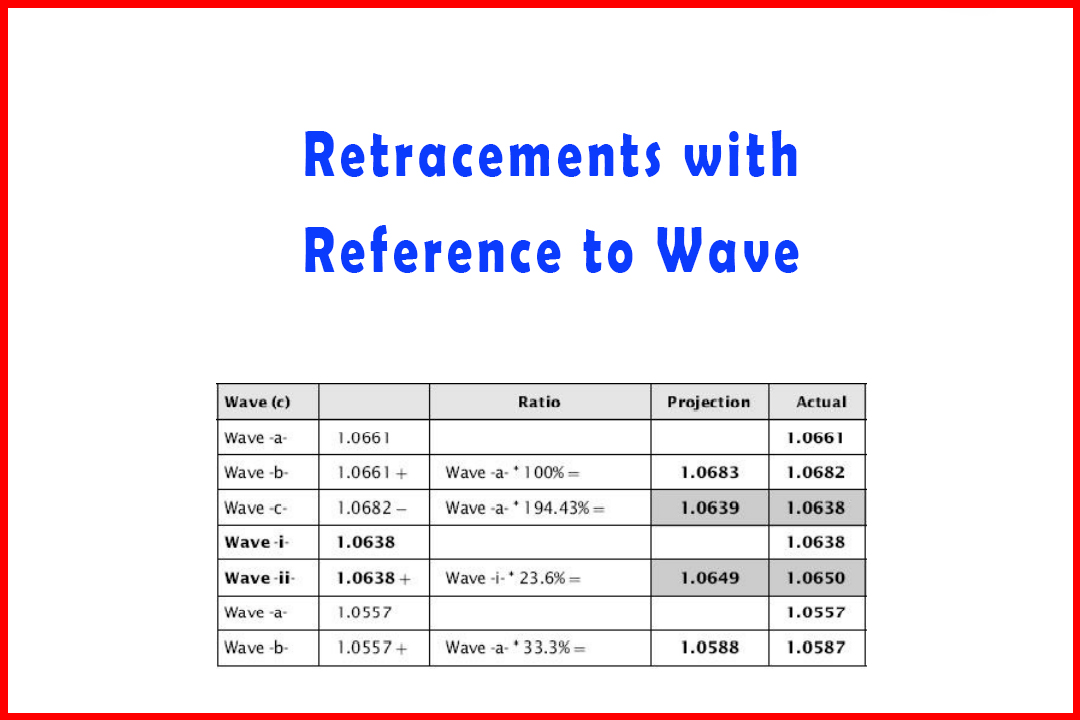
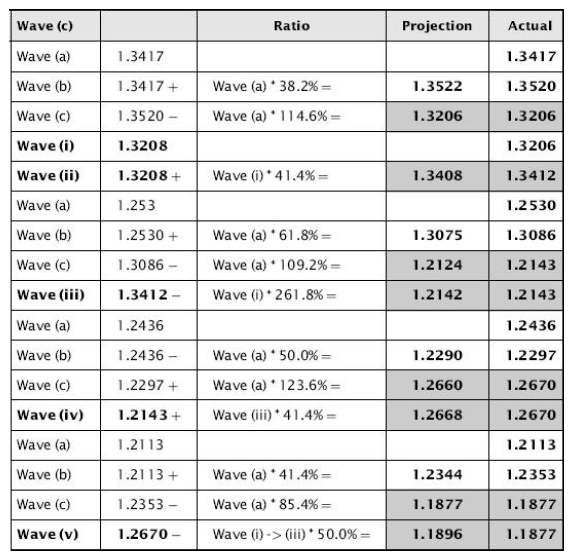
Table
4.4 shows the harmonic fractal nature of the modified structure and in general
holds quite accurate targets throughout. Note the deep Wave (b) of 61.8% but
which slots in nicely with the projection in Wave (iii). Both Wave (ii) and
Wave (iv) were modestly shallow at 41.4%. While the final 50% projection in
Wave (v) is not uncommon, it is not one that I usually look for but should be
considered if there is a discrepancy with the targets of one higher degree. In
this case the larger Wave (c) lower displayed was a normal extension ratio of
Wave (a) and also of Wave (i).
Table 4.4 Wave
Relationships for the Five-Wave Decline in Figure 4.9
Harmonic Elliott Wave : Chapter 4: Projection and Retracement Ratios : Tag: Elliott Wave, Forex, Fibonacci : Extended Wave Trading Strategy, Harmonic wave, Fibonacci ratios, harmonic structure - Extended Wave Examples
Elliott Wave | Forex | Fibonacci |