Elliott Structure versus the Modified Harmonic Relationships
Elliott wave structure, Harmonic Pattern, Five wave pattern, harmonic wave structure
Course: [ Harmonic Elliott Wave : Chapter 4: Projection and Retracement Ratios ]
Elliott Wave | Forex | Fibonacci |
As another example of how the extended waves in Elliott's original structure fail to stand up to rigorous wave relationships, I will provide an example of an apparent impulsive decline in hourly GBPUSD and compare wave relationships between Elliott's structure and the harmonic structure.
Elliott Structure Relationships versus the Modified Harmonic Relationships
As
another example of how the extended waves in Elliott's original
structure fail to stand up to rigorous wave relationships, I will provide an
example of an apparent impulsive decline in hourly GBPUSD and compare wave
relationships between Elliott's structure and the harmonic structure.
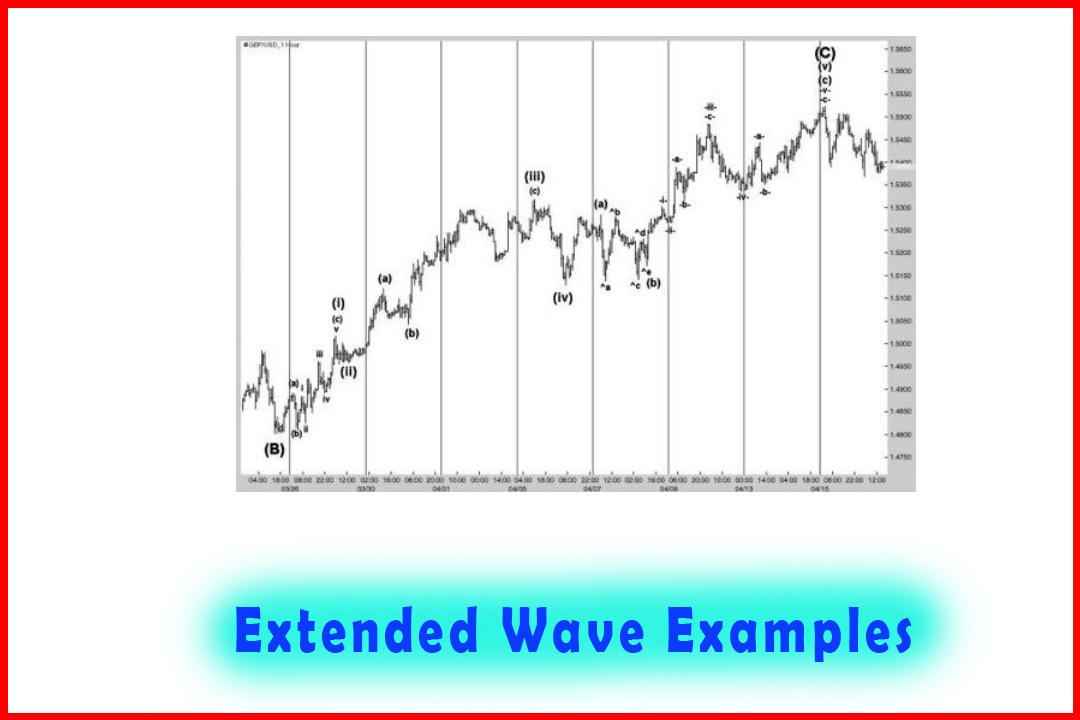
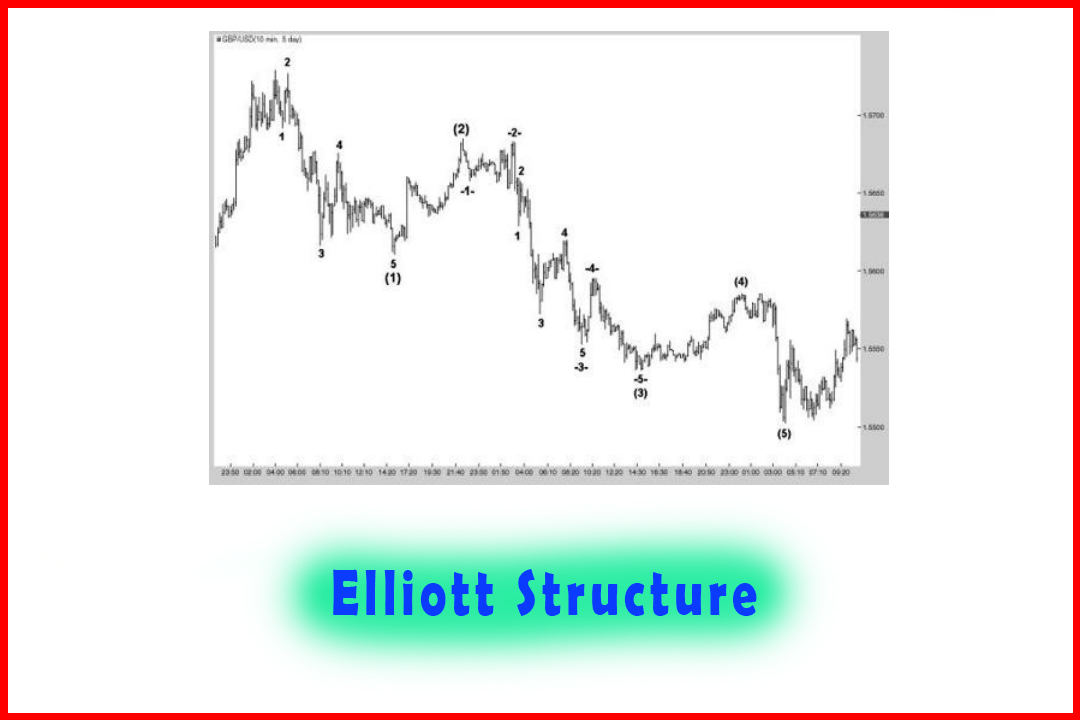
Figure
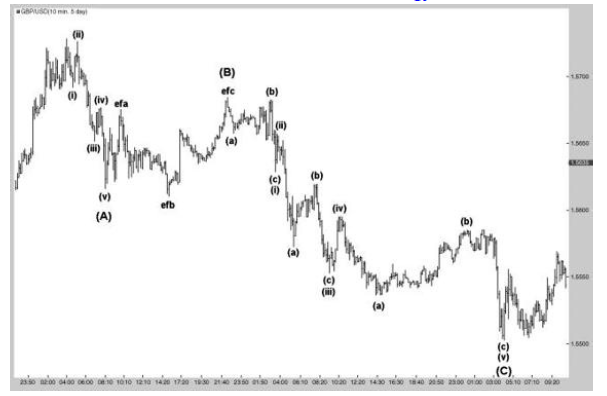
4.11 displays the decline in the hourly GBPUSD market. This appears to decline
in a complex five-wave move in which Wave (3) has a double extension. Apart
from the correction in Wave (2), all the swing highs and swing lows are
declining, confirming a bearish move. This decline followed a previous move
lower and therefore the implication is for another five-wave decline.
Figure 4.11 A
Complex Five-Wave Decline in GBPUSD
The
decline in Wave (1) does follow Elliott's structure of five waves with
Wave 3 being the longest and providing the main thrust of the decline. The
correction in Wave (2) appears normal, and this is followed by a Wave (3) which
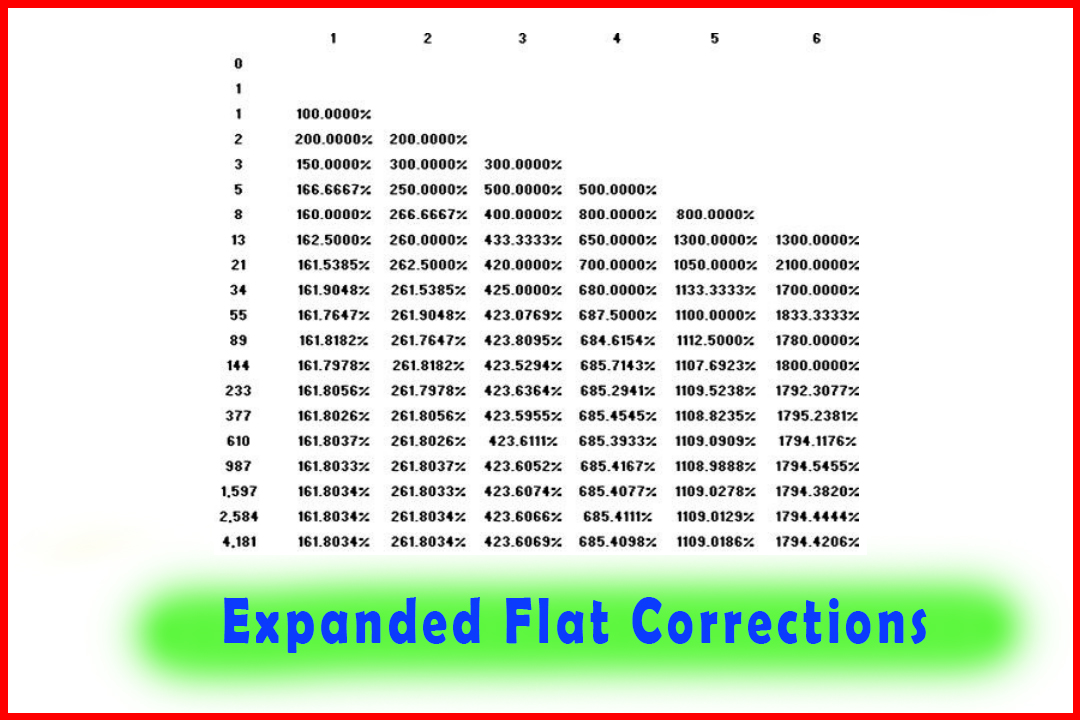
has extended twice. Wave -2-is an Expanded Flat with the rest of the decline
developing normally.
The
problems I habitually encountered with Elliott's structural
development were twofold. Firstly, these extended waves frequently lacked any
consistent wave relationships, and this generated the second problem of being
able to forecast where price should stall. To demonstrate the frustration I
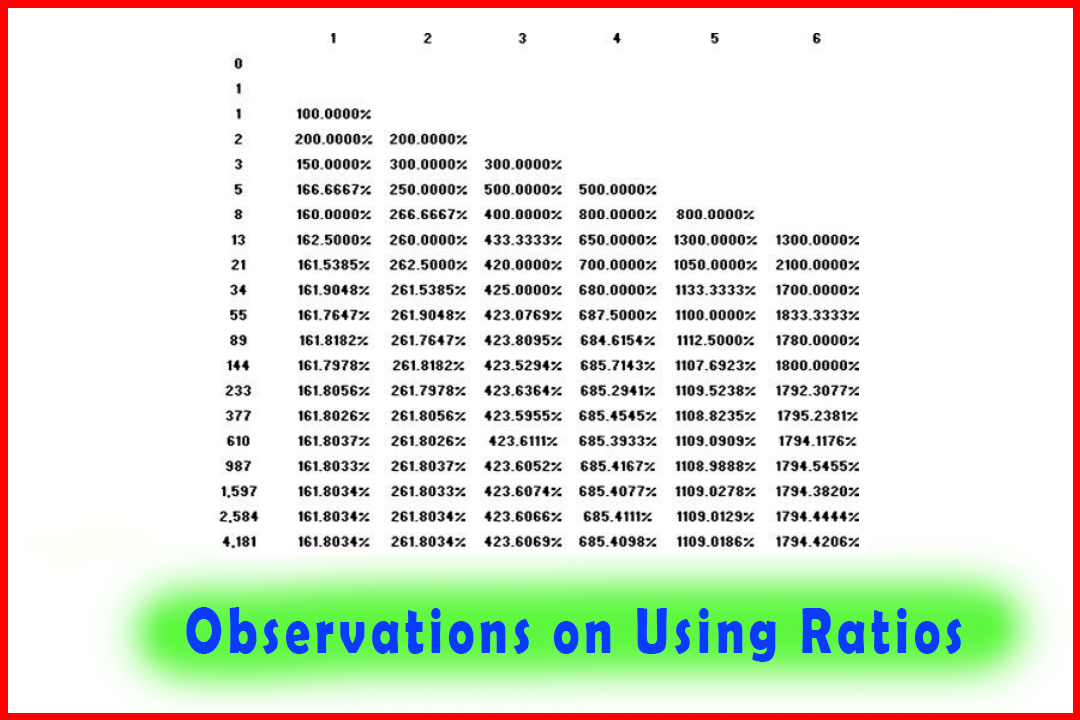
commonly encountered, the wave relationships are displayed in Table 4.6.
Table
4.6 Wave
Relationships
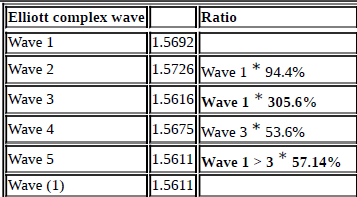
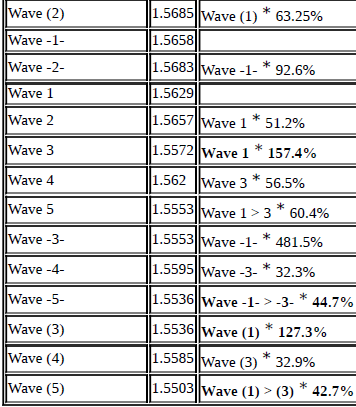
As
can be seen, there is a mixture of wave relationships. While there are some that
have the normal wave relationships I look for, within a reasonable deviation, I
have highlighted those which really would have posed serious issues in
forecasting.
It
was this type of imprecision that I found difficult to accept. On many
occasions the failure to be able to identify turns within a reasonable margin
saw reversals much earlier and left me in no man's land wondering
whether a correction was being seen and not a reversal. Anticipating extended
waves and where each Wave 1 would stall was a hit-or-miss affair, and then
everything became much more problematic.
Now
let's look at the same decline employing the harmonic wave structure.
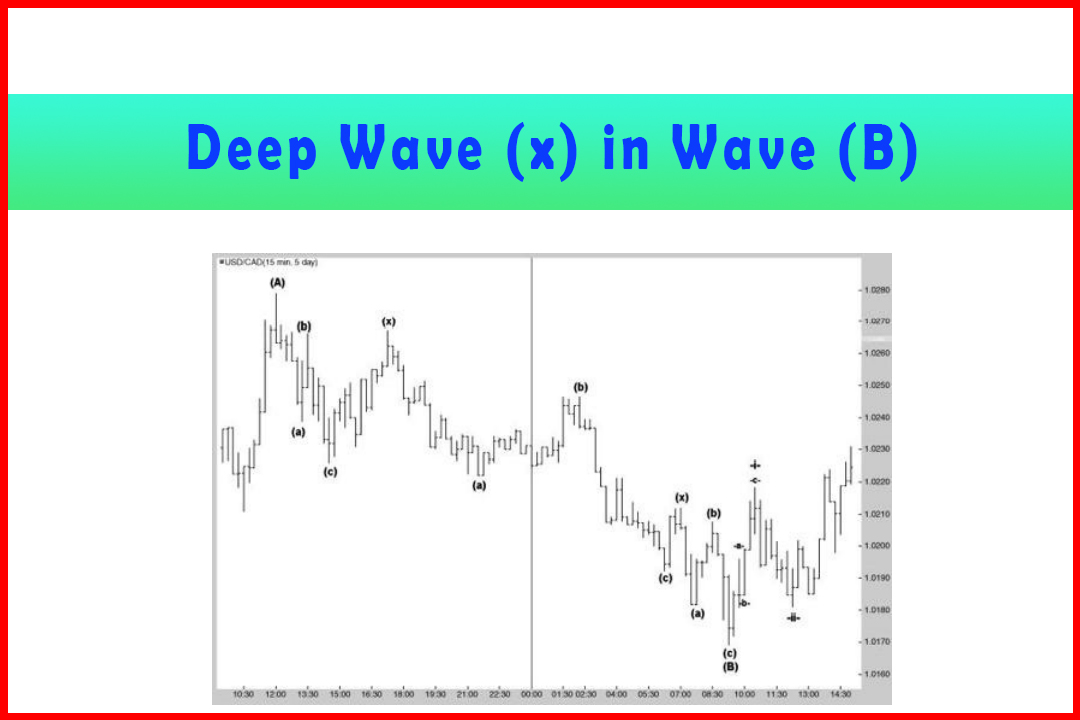
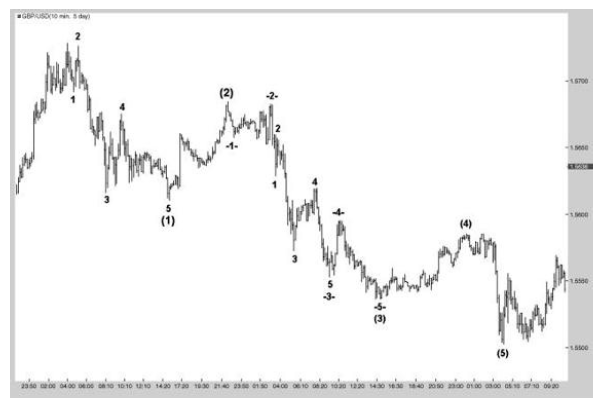
Figure
4.12 labels this completely differently as a three-wave decline. There will be
many Elliott Wave practitioners who will question this, but the evidence for
the count comes through the wave relationships which in this case provide
exceptionally accurate ratios that provided me with a much easier call for a reversal
higher.
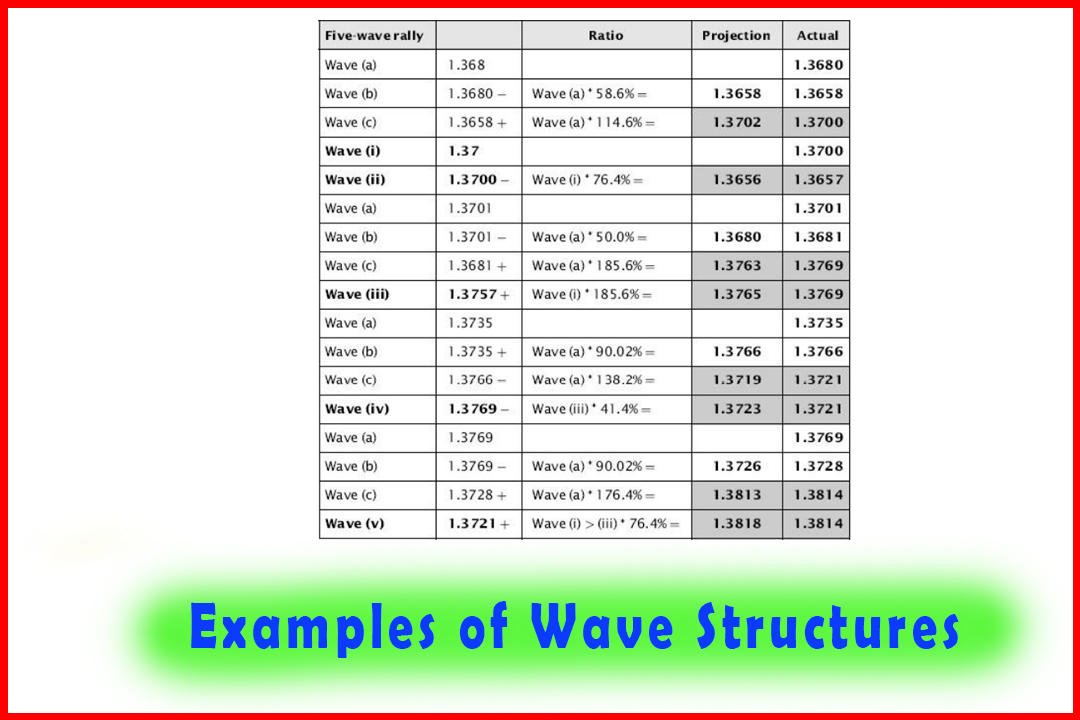
Figure 4.12 A
Harmonic Three-Wave Decline in GBPUSD
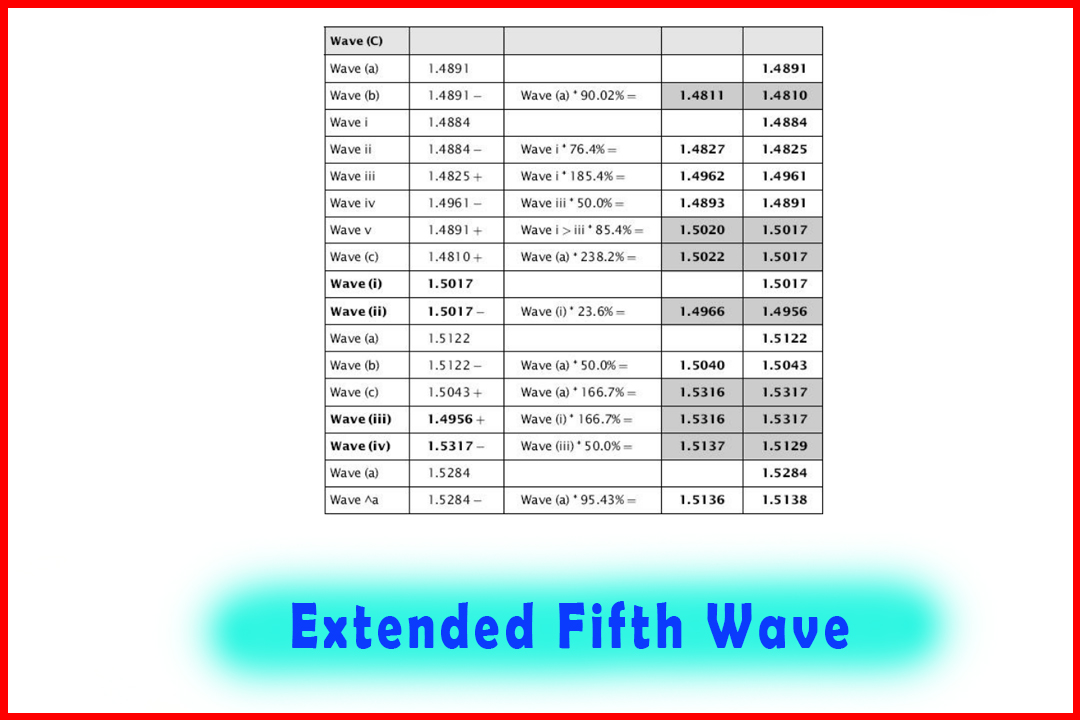
The
clarity of the wave relationships stands out from the first five-wave decline
in Wave (A) (as shown in Table 4.7). All relationships are common for their
position; the 198.4% projection in Wave (iii), the 33.3% retracement in Wave
(iv), and the 76.4% projection in Wave (v). The maximum variance was just three
points.
Table
4.7 Wave
Relationships for Three-Wave Decline in Figure 4.12
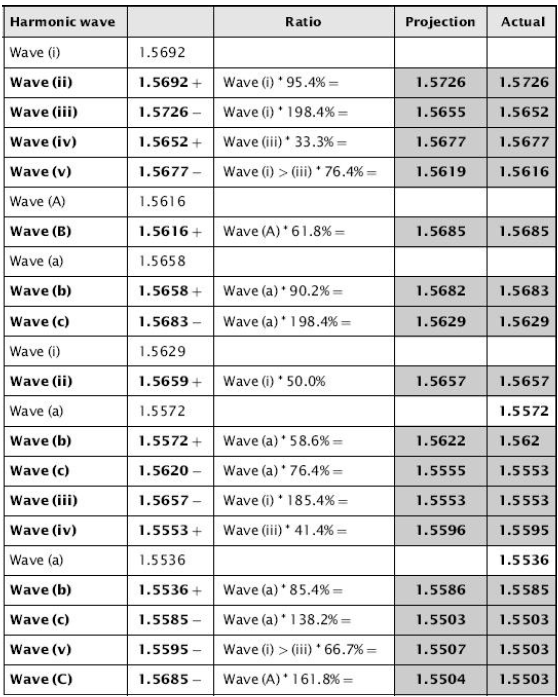
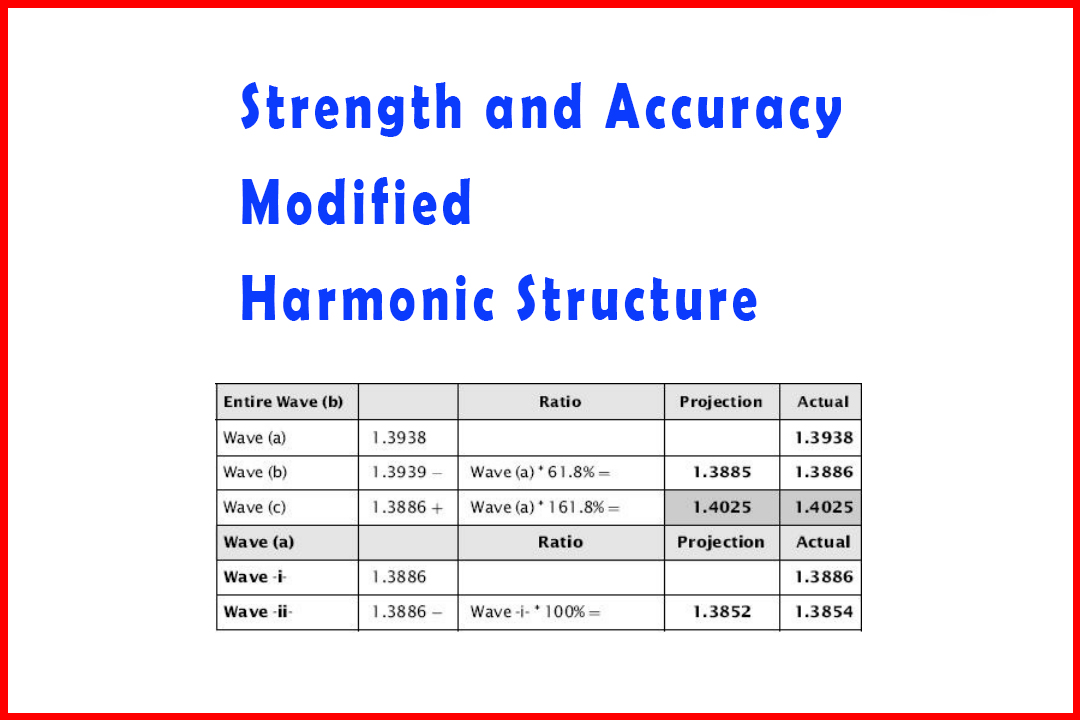
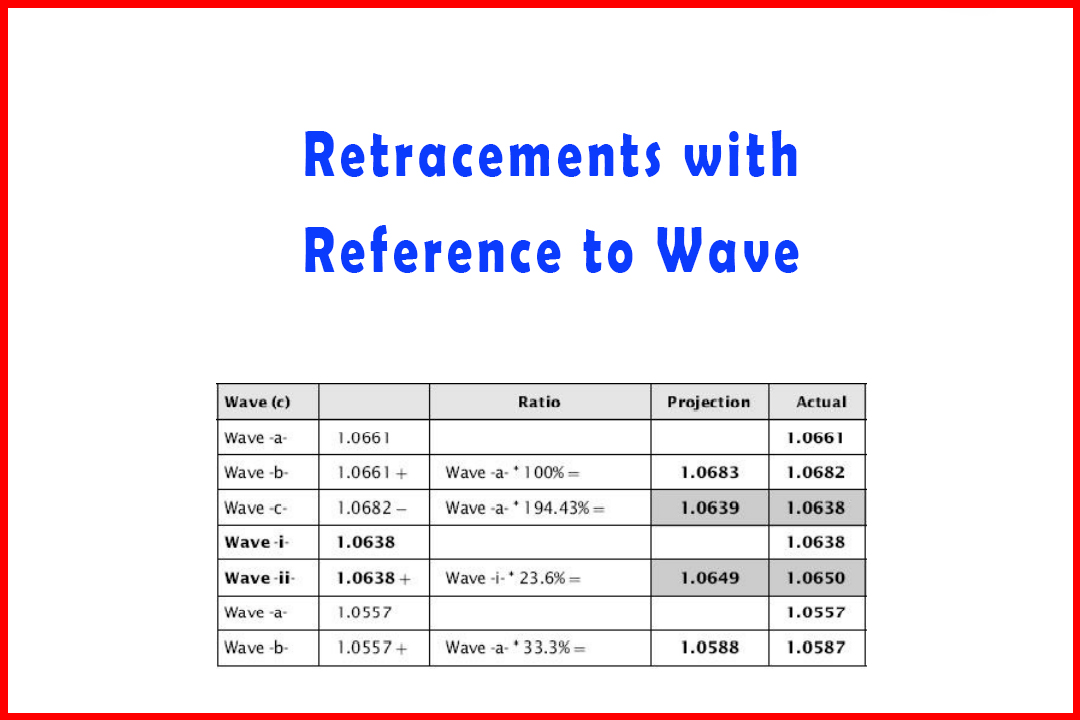
The
correction in Wave (B) developed as an Expanded Flat with the pullback being
exactly 61.8%. These common relationships continued throughout the entire
decline, even to the end where the extension in Wave (v) of Wave (C) was only
four points while the projection in Wave (C) was one point away from the exact
161.8% projection of Wave (A).
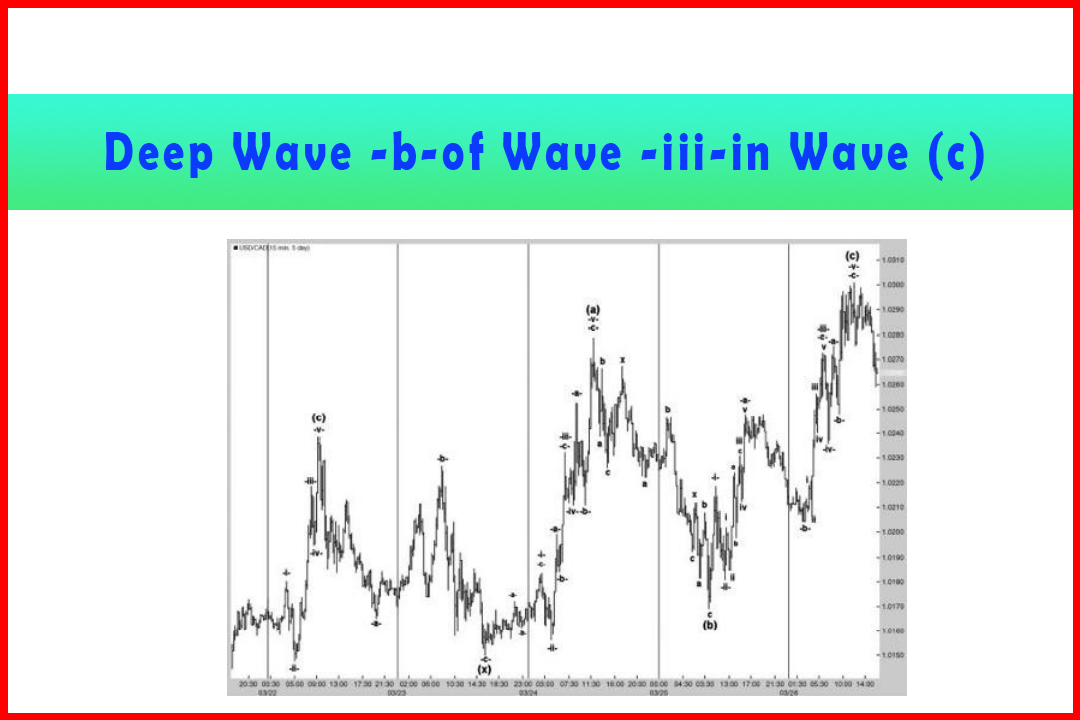
Figure
4.13 displays the resulting reversal higher to confirm the accuracy of the
harmonic structure.
Figure 4.13 Rally
Following the (A)(B)(C) Decline in GBPUSD

Harmonic Elliott Wave : Chapter 4: Projection and Retracement Ratios : Tag: Elliott Wave, Forex, Fibonacci : Elliott wave structure, Harmonic Pattern, Five wave pattern, harmonic wave structure - Elliott Structure versus the Modified Harmonic Relationships
Elliott Wave | Forex | Fibonacci |