Dumpling Tops and Frypan Bottoms Gap Trading Strategy
Dumpling top, Frypan bottom, Reversal pattern, How to trade reversal candlestick pattern, Pattern Trading Strategy
Course: [ JAPANESE CANDLESTICK CHART AND TECHNIQUES : Chapter 4: More Reversal Patterns ]
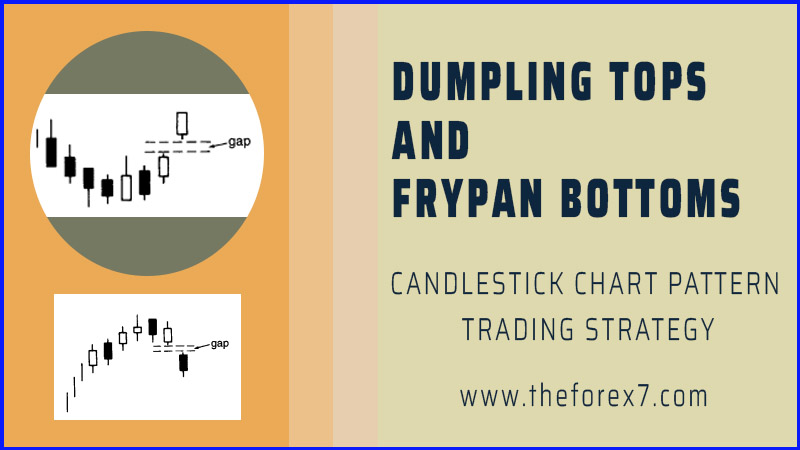
The dumpling top is a top reversal that usually has small real bodies as the market forms a convex pattern. Confirmation of the dumpling top is when the market gaps down. The frypan bottom reflects a market that is bottoming and whose price action forms a concave design and then opens a gap to the upside.
DUMPLING TOPS AND FRYPAN BOTTOMS
Dumpling
tops and frypan bottoms. Someone must have been hungry when they thought of
these names!
The
dumpling top (Exhibit 4.51) is a top reversal that usually has small
real bodies as the market forms a convex pattern. Confirmation of the dumpling
top is when the market gaps down. This pattern is the same as the Western
rounded top. The only difference is that the dumpling top has the extra bearish
kicker of a gap lower. (A gap down is called a “falling window" in candle
terminology. See Chapter 5.)

Exhibit
4.51. Dumpling Top
The
frypan bottom (Exhibit 4.52) reflects a market that is bottoming and
whose price action forms a concave design and then opens a gap to the upside
(i.e., a rising window). It has the same appearance as a Western rounded
bottom, but the Japanese frypan bottom must have a gap higher to confirm this
pattern.

Exhibit
4.52. Frypan Bottom
I
like the concept behind these patterns. With the frypan bottom, the market goes
from lower lows to the same lows and then higher lows. This pictorially proves
that the bears are losing a foothold. Then, when you add a rising gap to this
scenario, it gives even more proof that the bears have lost control of the
market.
The
Japanese will say that with a frypan bottom the market becomes "immune
to bad news." As such, if a market builds a frypan bottom—especially
in spite of bearish news—it would be very impressive. As Bernard Baruch stated,
"What is important are not the events themselves, but the human reaction
to these events."
The
same is true with the dumpling top, but in reverse. That is, the market is
ascending with higher highs and goes into a period where the highs are the
same, and then goes to lower highs. As such, the pace of the rally is
slackening. Then when you have a gap down to complete the dumpling top, it just
puts another nail in the bulls' coffin.
Exhibit
4.53 illustrates the dumpling top where the stock is making a series of higher
highs early on August 24. A few 60- minute sessions of long upper shadows and
the dark-cloud cover at noon on that day gave a minor clue of some hesitation
near $93.50. The final confirmation came with the lower highs made on the two
sessions after the dark-cloud cover and then the gap down, which completed the
dumpling top.
Exhibit
4.54 illustrates how IBM started stalling the week of July 12 as it went from
mostly white real bodies the preceding week to black real bodies that were
making mostly lower highs. The gap down completed the dumpling top.

Exhibit
4.53. Micron-60Minutes (Dumpling Top)

Exhibit
4.54. IBM-Daily (Dumpling Top)
In
mid July in Exhibit 4.55 the stock was holding its highs near $55. But look at
how these highs were being maintained— through a series of small real bodies
and even a long-legged doji on July 16. These spinning tops and doji showed
just how confused this stock really was. The gap down on the week of the 20th
completed a classic dumpling top. As will be discussed in Chapter 5, when there
is a gap down, that gap often becomes resistance. Note how the gap of this
dumpling top (made on July 24) became an upside barrier a few days later.
In
Exhibit 4.56 the July 7 long black candle reflected how hard this stock was
hit. The only mitigating factor was that session's lower shadow. But one
session's long lower shadow doesn't change the trend from down to more
positive. During the next few days, a series of long lower shadows echoed
support near $13.50. The appearance of a white candle on July 10 was a
successful defense of those lower shadows' support area that also completed a
bullish piercing pattern. With the next

Exhibit
4.55. Catalina Marketing-Daily (Dumpling Top)

Exhibit
4.56. General Motors-Daily (Frypan Bottom)
session's
higher low, and the gap higher on July 13, this stock had built a frypan
bottom.
In
Exhibit 4.57 a series of consecutive black candles during the week of July 19
kept the stock under pressure. Some diminutive real bodies and doji the next
couple of weeks hinted that the stock was stabilizing. Final bullish proof of
the breakout from this base came with a very small gap (shown at the arrow)
made between August 5 and 6. As this chart illustrates, even if the gap is very
small (i.e., a few cents) it is still considered a gap and thus validates this
frypan bottom. The same would be true with the dumpling top. That is, even if
there were a small gap to the downside, no matter how small, it would still
confirm a dumpling top.
Exhibit
4.58 nicely illustrates the difference between the Western rounding bottom and
the Eastern frypan bottom. From September 1 through the week of September 14,
the stock was building a rounding bottom (since it was going from lower lows to
the same lows and then higher lows). However, since this rounding bottom did
not have a rising gap, it was not a frypan bottom. Remember, a frypan bottom is
the same as a

Exhibit
4.57. Tele Nort-Daily (Frypan Bottom)

Exhibit
4.58. Earthshell-Daily (Frypan Bottom)
rounding
bottom of the West, plus it has the extract push of a gap higher. With the
aforementioned September's rounding bottom, we get signs of caution at 1 and 2
with their long upper shadows (2 was a shooting star).
Let's
now turn our attention to activity from early to the latter part of October. At
that time the stock was building a rounding bottom (that is, going from lower
lows to higher lows). With the small rising gap on September 26, it became a
frypan bottom with all its inherent bullish potential. Because of the rising
gap in the frypan bottom (that the classic rounding bottom lacks), I view
frypan bottom as more significant than a classic rounding bottom.
JAPANESE CANDLESTICK CHART AND TECHNIQUES : Chapter 4: More Reversal Patterns : Tag: Candlestick Pattern Trading, Forex : Dumpling top, Frypan bottom, Reversal pattern, How to trade reversal candlestick pattern, Pattern Trading Strategy - Dumpling Tops and Frypan Bottoms Gap Trading Strategy