Upside-Cap Two Crows - Candlestick Pattern
upside-cap two crows trading strategy, Best candlestick pattern, Stock trading Pattern
Course: [ JAPANESE CANDLESTICK CHART AND TECHNIQUES : Chapter 4: More Reversal Patterns ]
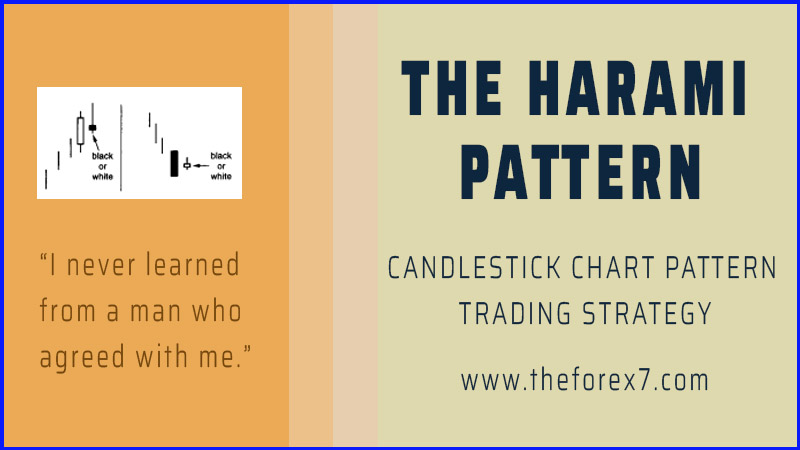
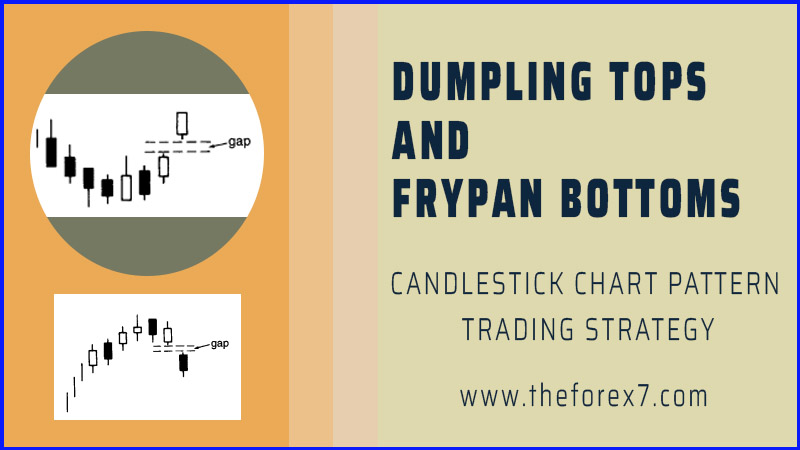
An upside-gap two crows (what a mouthful!) is illustrated . It is very rare. The upside-gap refers to the gap between the real body of the small black real body and the real body preceding it.
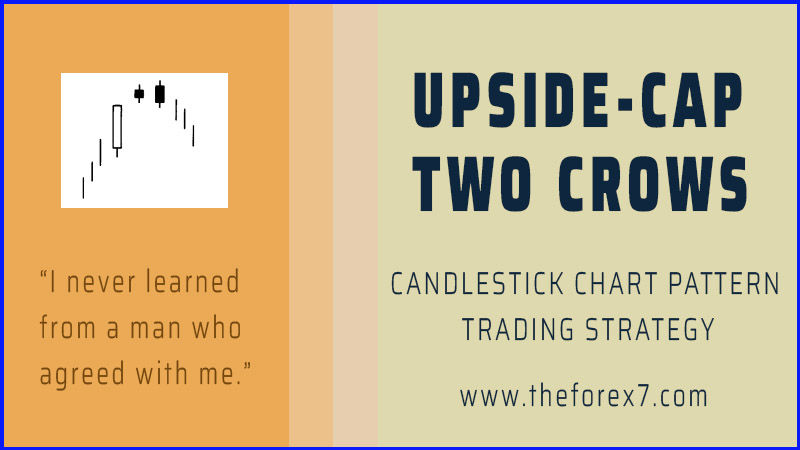
UPSIDE-CAP TWO CROWS

Exhibit
4.23. Upside-Gap Two Crows
An
upside-gap two crows (what a mouthful!) is illustrated in Exhibit 4.23.
It is very rare. The upside-gap refers to the gap between the real body of the
small black real body and the real body preceding it. (The real body that
precedes the first black candle is usually a long white one.) The two black
candles are the "crows" in this pattern. They are analogous to black
crows peering down ominously from a tree branch. Based on this por-tentous
comparison, it is obviously a bearish pattern. An ideal upside-gap two crows
has the second black real body opening above the first black real body's open.
It then closes under the first black candle's close.
The
rationale for the bearish aspect of this pattern is as follows: The market is
in an uptrend and gaps higher on the open.

Exhibit
4.24. Deutsche Mark-Daily (Upside-Gap Two Crows)

Exhibit
4.25. Corning-Daily (Upside-Gap Two Crows)
The
new highs fail to hold and the market forms a black candle. But the bulls can
take some succor, at least, because the close on this black candle session
still holds above the prior day's close. The third session paints a more
bearish portrait with another new high and another failure to hold these highs
into the close. More negative, however, is that this session closes under the
prior day's close. If the market is so strong, why did the new highs fail to
hold and why did the market close lower? Those are the questions that the bulls
are probably nervously asking themselves. The answers might be that the market
may not be so strong as they would like. If prices fail to regain high ground
the next day (that is, the fourth session), then expect lower prices.
Exhibit
4.24 has an example of the upside-gap two crows. The very small falling gap
after this pattern highlighted the bears had taken control. The rally on the
week of February 20 stalled at this gap's resistance.
Exhibit
4.25 illustrates the significance of viewing a candle pattern to its immediate
surroundings. Although there was an upside-gap two crows in mid July, this
would not have been a signal to sell. This is because, as will be discussed in
detail in Chapter 5, the stock gapped higher on July 7. A gap up is normally a
bullish sign—whether with candles or bar charts. Thus, while the upside-gap two
crows sends out a warning, I would view it as less bearish than would be the
case in which there was no gap, such as in Exhibit 4.24.
JAPANESE CANDLESTICK CHART AND TECHNIQUES : Chapter 4: More Reversal Patterns : Tag: Candlestick Pattern Trading, Forex : upside-cap two crows trading strategy, Best candlestick pattern, Stock trading Pattern - Upside-Cap Two Crows - Candlestick Pattern