How to Read Tweezers Tops and Tweezers Bottoms Candlestick Patterns
Single candlestick patterns, Types of candlesticks, Powerful candlestick patterns, Candlestick chart analysis, Bearish candlestick patterns, Bottom reversal Pattern, Top reversal pattern
Course: [ JAPANESE CANDLESTICK CHART AND TECHNIQUES : Chapter 4: More Reversal Patterns ]
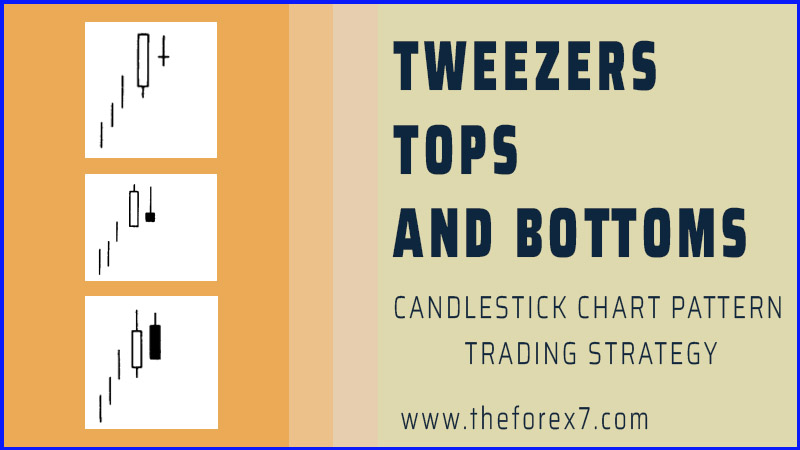
Tweezers are two or more candle lines with matching highs or lows. They are called tweezers tops and tweezers bottoms because they are compared to the two prongs of a tweezers.
TWEEZERS TOPS AND BOTTOMS
Tweezers
are two or more candle lines with matching highs or lows. They are called
tweezers tops and tweezers bottoms because they are compared to the two prongs
of a tweezers. In a rising market, a tweezers top is formed when the two or
more consecutive highs match. In a falling market, a tweezers bottom is made
when two or more successive lows are the same. The tweezers could be composed
of real bodies, shadows, and/or doji. Ideally the tweezers should have a long
first candle and a small real body as the next session. This shows that
whatever force the market had on the first session (bullish force with a long
white candle and bearish force with a long black candle), it was dissolving
with the following small real body with the same high (for a tweezers top) or
same low (for a tweezers bottom). If there is a bearish (for a top reversal)
or a bullish (for a bottom reversal) candle signal that is also a tweezers top,
it adds more importance to the pattern.
Let's
look at Exhibits 4.8 to 4.13 in detail:
Tweezers Top and Harami cross

Exhibit
4.8. Tweezers Top and Harami cross
ü
Exhibit 4.8
shows how, during an ascent, a long white line is followed by a doji. This
two-candle pattern, a harami cross with the same high, can be a significant
warning.
Tweezers Top and Hanging Man

Exhibit
4.9. Tweezers Top and Hanging Man
ü Exhibit 4.9 illustrates a tweezers top formed by a
long white candle and a hanging man line. If the market opens, and especially
closes, under the hanging man's real body, odds are strong that a top has been
reached. This two-line mixture can also be considered a harami. As such, it
would be a top reversal pattern during an uptrend.
Tweezers Top and Shooting Star

Exhibit
4.8. Tweezers Top and Shooting Star
ü
Exhibit 4.10
illustrates a tweezers top joined with the second period's bearish shooting
star line.
Tweezers Top and Dark-Cloud Cover

Exhibit
4.11. Tweezers Top and Dark-Cloud Cover
ü
As
mentioned earlier, an ideal tweezers would have as its second session not only
the same high, but also a small real body. In Exhibit 4.11 the second candle is
not a small real body. However, this second session completes a variation on
the dark-cloud cover (the second day opens above the prior day's close instead
of above the prior day's high). The black candle session's high also just
touches the prior period's high and then falls. Because of this last fact—that
is, both sessions have the same highs—it adds more negative impact to this
variation of the dark-cloud cover.
Tweezers Top and Hammer

Exhibit
4.12. Tweezers Top and Hammer
ü
Exhibit 4.12
shows a hammer session that successfully tests the prior long black
candlestick's lows. The hammer, and the successful test of support, proves that
the sellers are losing control of the market. This two-line combination is also
a harami. This would be another reason to view this action as support.
Tweezers Top and Harami cross

Exhibit
4.13. Tweezers Top and Harami cross
ü
Exhibit 4.13,
while it doesn't have a small real body for the second candle, does complete a
variation on the bullish piercing line. (A true piercing line would open under
the prior day's low. Here it opened under the prior day's close.) Because of
this I view it also as a tweezers bottom.
These
examples of tweezers are not inclusive. They are representative of how top and
bottom tweezers should be confirmed by other candlestick indications so as to
be valuable forecasting tools.
Tweezers
should be viewed differently for daily, intraday, and weekly or long charts.
This is because there is nothing potent about having the same highs or lows for
two daily or intraday sessions. It's only if these sessions also meet the
specific criteria for a tweezers (the first long, the second short, or a candle
pattern with the same highs or same lows) does it warrant attention. As such,
the main aspect to keep in mind with tweezers on a daily or intraday chart is
that it takes a special combination of candle lines to warrant acting upon
tweezers.
For
those who want a longer time perspective, tweezers tops and bottoms on the
weekly and monthly candlestick charts made by consecutive candlesticks could be
important reversal patterns. This would be true even without other candle
confirmation because, on a weekly or monthly chart, for example, a weekly low
this week that successfully holds last week's lows could be a base for a rally.
The same can't be said of daily or intraday lows.
Exhibit
4.14 shows the tweezers bottom. Note that the second real body of this tweezers
was not within the first real body and as such was not a harami pattern. The
long white candle after these tweezers on June 1 was immediately followed by a
small real body with about the same high near $59.50. As such, the June 1 and
June 2 combination can be viewed as the tweezers top. But in the context of the
overall technical picture, the market was not overextended and, as such, not so
vulnerable to a correction as should be the case if we had a tweezers top in an
overbought environment. Even if one acted upon the June 1 and June 2 tweezers
top (it was also a harami), once the market closed above the high of these two
sessions on June 3, any potential bearish implication of the tweezers top was
negated.
In
Exhibit 4.15 a series of falling gaps (gaps are called "windows" in
candle charts; windows are discussed in detail in Chapter 5) at 1,2, and 3 kept
the bearish momentum in force. A tweezers bottom unfolded with the second
candle of the tweezers bottom a hammer. A dark-cloud cover in the week of the

Exhibit
4.14. Caterpillar-Daily (Tweezers Bottom)

Exhibit
4.15. Gergia-Pacific-Daily (Tweezers Bottom)

Exhibit
4.16. Dell-Daily (Tweezers Top)
18th
showed that the upward power of the market was dissipating.
Exhibit
4.16 illustrates a tweezers top. Since the small real body on February 2 was
not within the prior real body, this would not have been a harami pattern, but
it was a tweezers because of the same high at $55. In addition, the small real
body on February 2 was a hanging man line (the upper shadow is small enough to
keep this as a hanging man line). Of course, this (like any hanging man line)
required bearish confirmation by a close under the hanging man's real body.
This occurred the next session.
Dell
descended from these tweezers top until a series of hammers in late
February-early March showed an area of stabilization. The first two hammers on
February 26 and March 1 were not a classic tweezers bottom. Why? While they
certainly have the same lows, the duel hammers did not meet one of the normal
criterion for a tweezers bottom—having the first candle of the tweezers bottom
a long real body. While the dual hammers on February 26 and March 1 were not
classified as a tweezers bottom, I certainly would emphasize their importance
since

Exhibit
4.17. Commerce Boncorp

Exhibit
4.18. Network Solutions-Daily (Tweezers Top)
they
underscored how the market was rejecting lower prices at $39 with bullish long
lower shadows. As such, I would view the pattern on February 26 and 27 as a
variation of a tweezers bottom.
While
the two candle lines on December 22 and 23 in Exhibit 4.17 did not form a
dark-cloud cover (since the black candle wasn't even near the middle of the
long white candle), they did form a tweezers top. While I would view a
dark-cloud cover as more ominous than a tweezers top (since the regular
dark-cloud cover closes well into the white candle), this tweezers top could
certainly be viewed as a cautionary signal. This was echoed the next week with
the small real bodies and doji reflecting that the market had gone from a
bullish bias to more neutral.
A
bullish engulfing pattern at B in Exhibit 4.18 lays the foundation in early
February for a rally that continued via a gap on March 6. As discussed in
Chapter 5, the bottom of a rising gap can become support. The support at the
bottom of this gap near $185 held very well, as attested by the long lower
shadow candle of March 8.
On
March 10, near $250, a small real body produced a harami pattern. Since the two
candle lines of the harami had the same highs, it was also a tweezers top.
JAPANESE CANDLESTICK CHART AND TECHNIQUES : Chapter 4: More Reversal Patterns : Tag: Candlestick Pattern Trading, Forex : Single candlestick patterns, Types of candlesticks, Powerful candlestick patterns, Candlestick chart analysis, Bearish candlestick patterns, Bottom reversal Pattern, Top reversal pattern - How to Read Tweezers Tops and Tweezers Bottoms Candlestick Patterns