Multiple Time Frame Analysis for Day Trading – Forex Trading
Multiple Time Frame Trade Setup, Daily chart analysis, One hour chart Analysis, Swing Trading analysis
Course: [ Top Trading Strategy ]
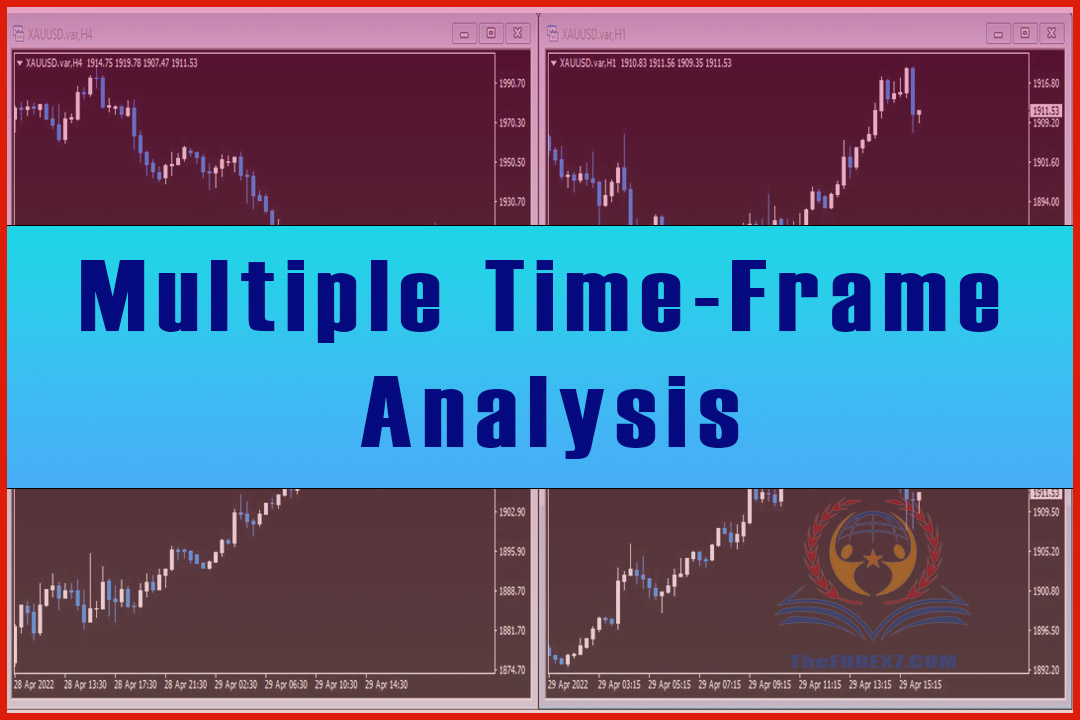
As mentioned before, chart patterns and technical signals have more weight on a longer-term chart compared to a short-term one. Multiple time-frame analysis is all about analyzing patterns on different time-frames so that you get a much better technical overview of the currency pair that you are trading. For example, if the daily chart looks very bearish, and you are thinking of buying on a 5 min chart, you'd better think twice. Whether you scalp, day-trade or position-trade, it is absolutely essential for you to adopt multiple time-frame analysis.
Multiple Time-Frame Analysis
Before you start applying the technical tools
that I have introduced you to, the first question you have to ask yourself is:
what time-frame are you going to trade the Forex market?
What is Multiple Time-frame Analysis?
As mentioned before, chart patterns and
technical signals have more weight on a longer-term chart compared to a
short-term one. Multiple time-frame analysis is all about analyzing patterns on
different time-frames so that you get a much better technical overview of the
currency pair that you are trading. For example, if the daily chart looks very
bearish, and you are thinking of buying on a 5 min chart, you'd better think
twice. Whether you scalp, day-trade or position-trade, it is absolutely
essential for you to adopt multiple time-frame analysis.
My approach is to use a three screen system
consisting of (1) a long-term time-frame, (2) an intermediate time-frame and
(3) a short-term time-frame.
Time-Frame Suggestions
Day-traders or swing traders, who are looking to
hold their positions for less than a day or for up to a week, may use the
following time-frames:
1. Daily chart
Even if you trade 5 min charts, looking at a
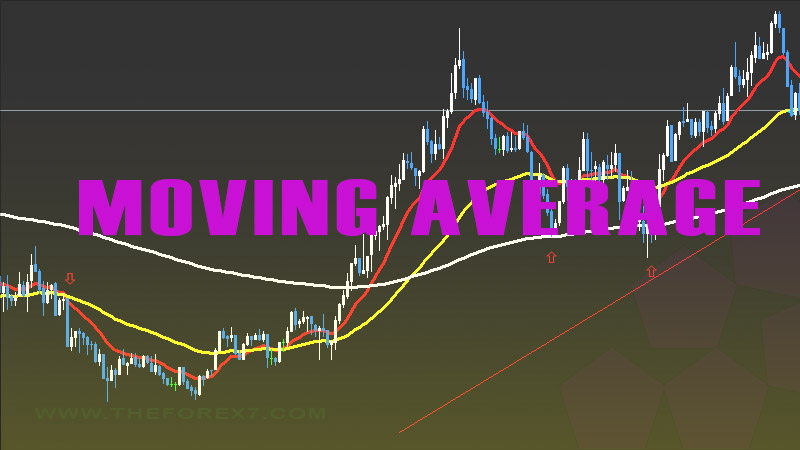
daily chart will greatly widen your perspective. Use moving averages as
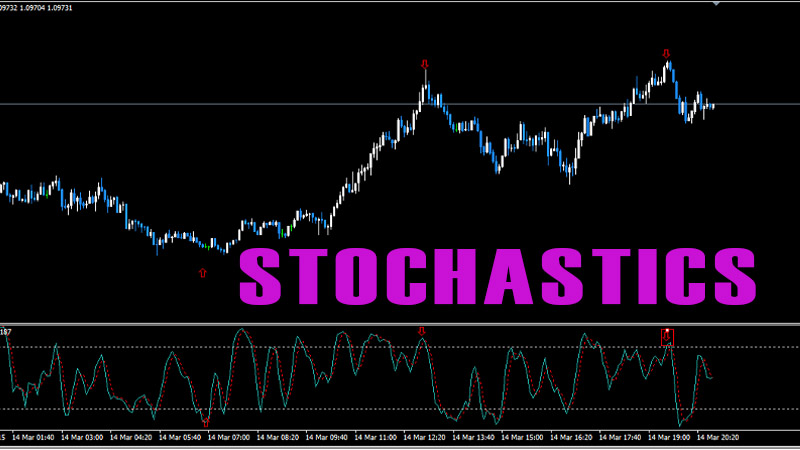
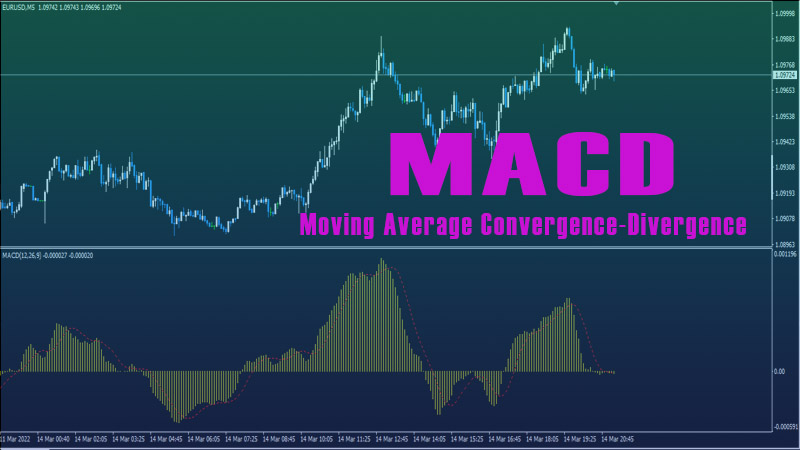
trend-following indicators, and Slow Stochastics and MACD Histogram as momentum
indicators. Identify swing highs and swing lows for Fibonacci retracement
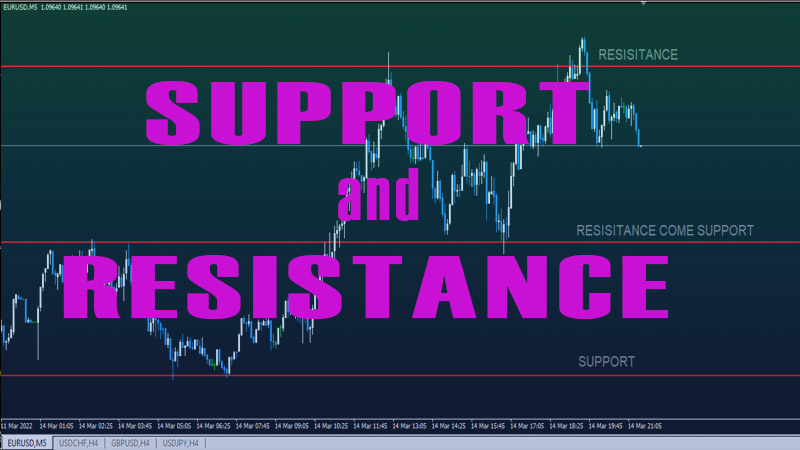
levels. Indicate support and resistance levels, and draw up and down trendlines
on your daily chart. Trade in the direction of the trend as shown in the daily
chart unless you think that the market is about to reverse the trend. For
example, if the daily chart and market sentiment looks bearish to me, I will
only look for shorting opportunities on the 60 min chart. If daily signals are
particularly strong on that day, I will enter my trade based on the daily
chart.
2. Hourly chart
A 60 min chart will show you more details, and
you may predict the intraday support and resistance levels based on it.
Similarly, set up your trend-following and momentum indicators, indicate
support and resistance levels, and draw up and down trendlines on your hourly
chart. If you intend to hold your position for less than a day, this hourly
chart gives you an idea of where you could put your protective stop and profit
objective. When I intend to hold a trade for less than a day or a 1-2 days max,
I use the 60 min chart to pinpoint my entry, and then confirm with the daily
chart to make sure that there are no trendlines or moving averages blocking my
entry.
3. 5 min chart
This is the main time-frame that you will be
monitoring the currency pair most closely. If you use the 5 min chart to
pinpoint your entry, always double-check with the hourly and daily chart.
The above suggestions are only guidelines. The
multiple time-frames that you choose will depend on your trading style
(frequency) and personality. Regardless of which time-frame you trade, it is
always better to first analyse a larger time-frame, but monitor the smallest
time-frame. It is essential even for a short-term trader to go with the overall
trend.
You will be spending the bulk of your time analyzing the multiple time-frames,
and calculating if the trades are worth placing. Look through your trading
checklist, and make sure to only spend your money on the high-probability
trades. Always remember that market sentiment will lead the technicals, so if
the sentiment is very bearish on a currency pair, but the technicals tell a
different story, it is better to trade in the direction of the sentiment
because even the most chart-perfect technical patterns will fail.
Real Chart Examples
Let's say the date is 12 May 2005, and we are pulling up the daily, hourly and 5 min charts to get an overview of the technicals.
Daily Chart of EUR/USD - Pre-trade
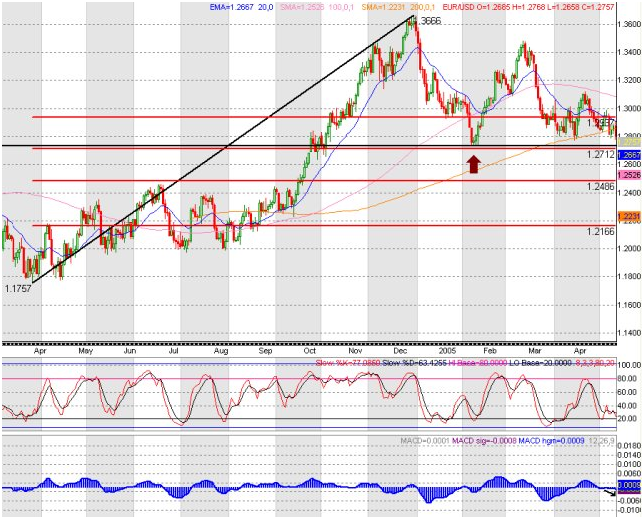
Figure 1 shows a Double Top, and that the last
candle on the chart ( 11 May 2005) is closely approaching the neckline at
1.2730 (neckline of Double Top indicated by brown arrow). Fibonacci retracement
lines drawn from the rally from 1.1757 to 1.3666 are in red, and their values
are at the right-hand side of the lines. The 50% retracement level is at
1.2712. Now we go look at the hourly chart below.
60 min Chart of EUR/USD - Pre-trade
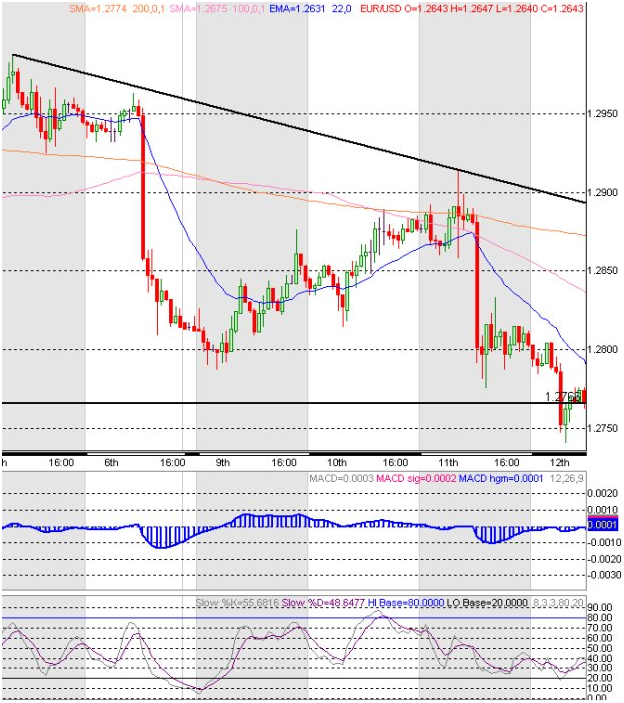
Figure 2 shows the hourly chart of EUR/USD, and you can see that on 12 May 2005, the price is closely approaching the neckline at 1.2730. The price is below the three moving averages, and MACD Histogram is hovering in the negative territory. The price has just gone below 1.2766, which is a support from almost a month ago. If you had only looked at the hourly chart, you might have shorted when it went below 1.2766, and not knowing from the daily chart that the neckline of a Double Top just lies not far below at 1.2730, where EUR/USD could rebound.
5 min Chart of EUR/USD - Pre-trade
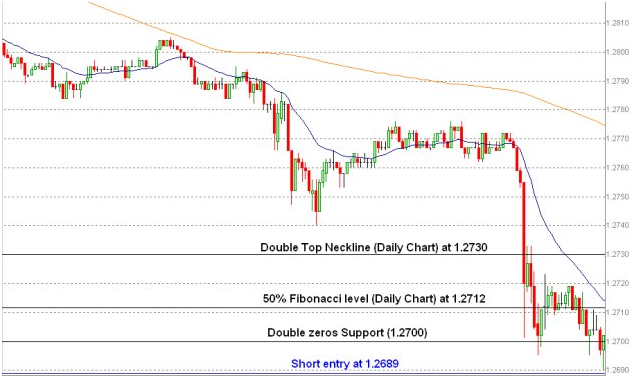
Figure 3 shows a 5 min chart of EUR/USD on 12 May 2005, on which I have indicated the price levels of the Double Top neckline and the 50% Fibonacci retracement.
Now having analysed all the multiple
time-frames, and assuming that the market sentiment has a bearish bias towards
EUR/USD, I will plan a short entry at 1.2689, which is 11 pips below the round
number support of 1.2700. Since the trade is based on a daily signal, I will set
a more long-term objective at the 78.6% Fibonacci retracement level on the
daily chart at around 1.2173 (1.2710 + 3 pips spread), with my stop slightly
above 1.2800. Since this is a strong signal and has a huge profit objective,
you may wish to set staggered price objectives so that you can take some profit
along the way with a few lots at each objective. When the trade moves into a
profit of at least 100 pips, we may wish to shift our stop to breakeven, and if
it moves even deeper into profit, we may then shift our stop more into profit,
or set it to be trailing.
If however you simply wish to trade for just a
day or two, you may set a much smaller objective, with a smaller but reasonable
stop.
Now let's look at what happened when EUR/USD
breached the Double Top neckline and 1.2700 on 12 May 2005.
Daily Chart of EUR/USD weeks after the Double Top neckline breakout
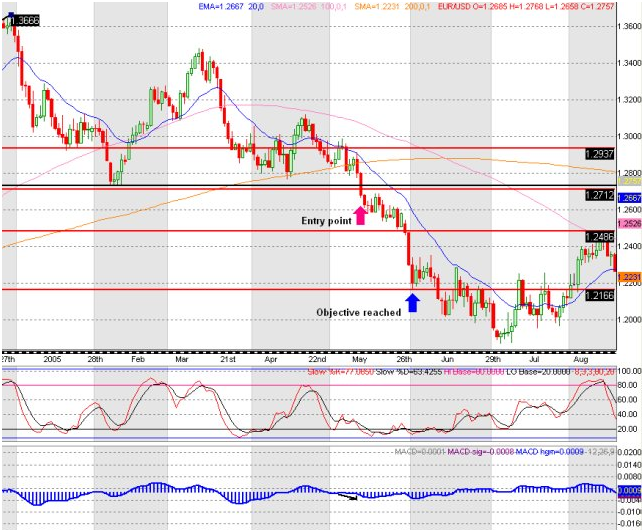
Figure
4
Trading Tips for Multiple Time-frame Analysis
- Analysis
of multiple time-frames will take up quite a bit of time. If you can't
spare the time to analyze them all, do yourself a favor by not trading
because your likelihood of failure will be quite high.
- If
you currently only trade off a single time-frame, or if you adopt an
intraday trading style using only one time-frame, I strongly recommend you
to adopt multiple time-frame analysis so as to increase your chances of a
good entry.
Top Trading Strategy : Tag: Top Trading Strategy, Forex : Multiple Time Frame Trade Setup, Daily chart analysis, One hour chart Analysis, Swing Trading analysis - Multiple Time Frame Analysis for Day Trading – Forex Trading