Filling in the Gap
trading why do gaps get filled, filling gap in stocks, filling gap in forex
Course: [ The Candlestick and Pivot Point Trading Triggers : Chapter 2. Determining Market Condition ]
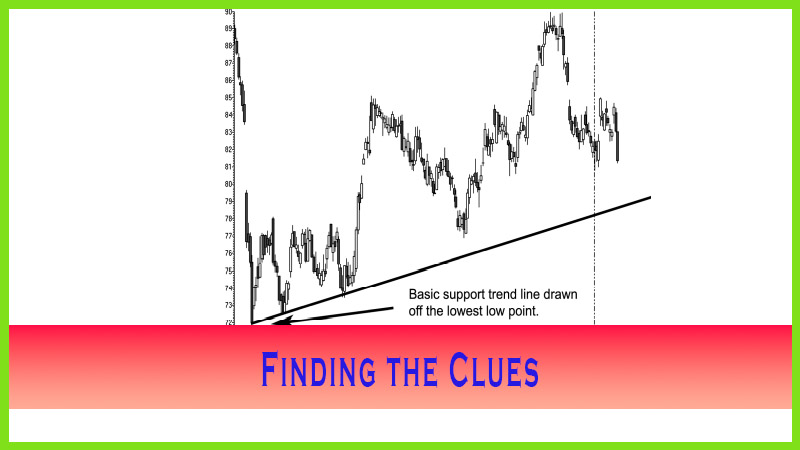
As you can see in Figure 2.10, the gaps that occur show that prices move too far too fast in one direction, which is a condition known as overbought or oversold.
FILLING IN THE GAP
As you
can see in Figure 2.10, the gaps that occur show that prices move too far too
fast in one direction, which is a condition known as overbought or oversold.
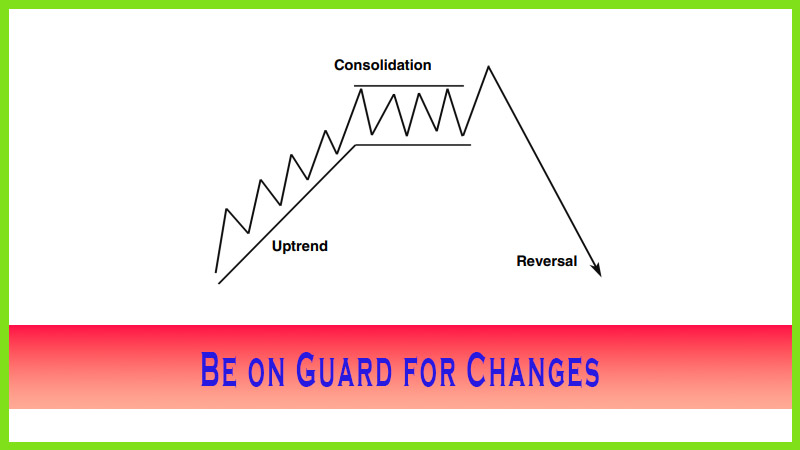
Those moves are unsustainable and thus form what we call overvalued or
undervalued in relation to the trend line or moving average. Most market
behavior as reflected by the human emotional state goes into extremes. This is
even the case in trending markets: They move either too fast or too far in any
one direction and then simply pause or correct back above or below the various
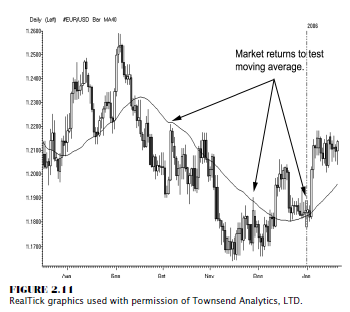
moving averages, as you will see. The chart in
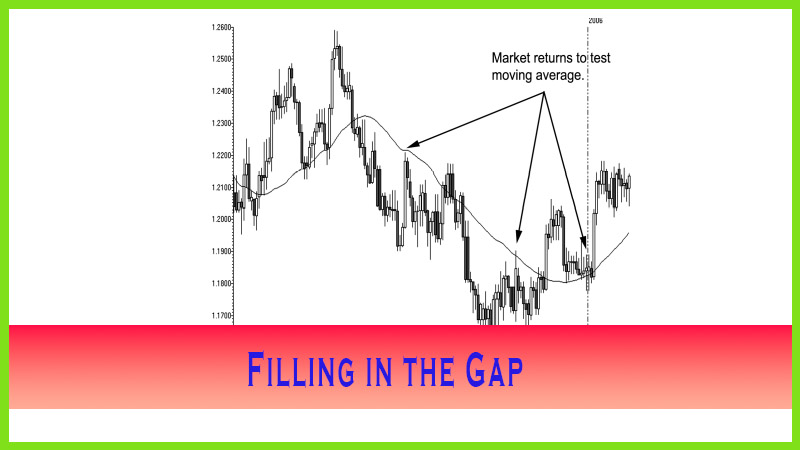
Figure
2.11 is the spot euro currency. This market has an inverse relationship with
the U.S. dollar. As the dollar moved lower, the euro moved higher, and vice
versa. Notice that when it separates too far away from the longer- term moving
average (M/A), it would return back to test the M/A as a support line or fill
the gap, as it is known. Finally, as it breaks below the M/A support in the
middle of September, it declines too far too fast and returns back up to test
the line, which now acts as a resistance trend line.
In
conclusion, trend lines and moving averages help us determine the price
direction of a given market at a given time. They can also help us discover
when a market is overbought or oversold. In simple terms, when we use moving
averages, the more time periods we use, the slower or less sensitive moving
averages are to price changes. Prices will trade and close below a moving
average in a bearish market condition, or a downtrend; and prices will trade
or, more important, close above a moving average in a bullish market condition,
or uptrend. Introducing more than one moving average with two different
calculated values, such as 10-period and 20-period simple moving averages on a
closing basis, will generate buy and sell signals as one value crosses above or
below the other. We can compute and change the variables we use as well, such as
closes and volatility calculations.
Moving averages help in the development of
trading strategies, as we will see in later chapters. There are also variables
other than just a simple moving average based on a closing time period that you
can use. I will introduce to you a pivot point moving average method in Chapter
6.
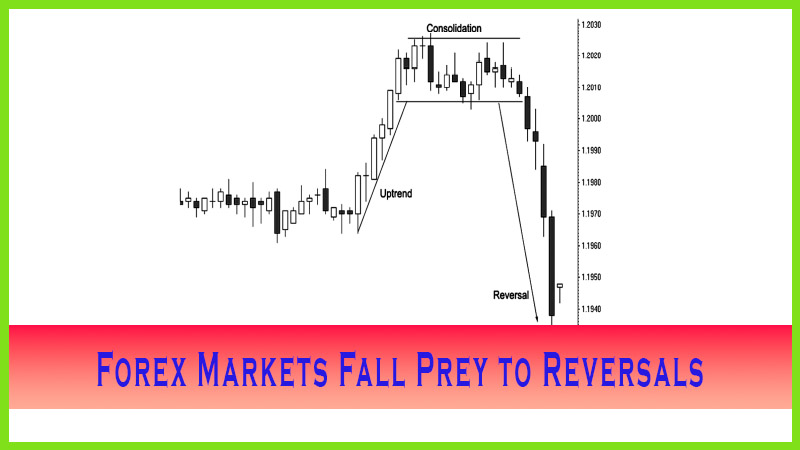
Forex, or
currency, markets tend to establish longer-term trends, so moving average
studies are very popular with these markets. Also, moving average systems can
be back-tested; therefore, hypothetical results can be produced for those
looking to explore running a hedge fund.
In the next few chapters, we will introduce the pivot point system and incorporate that as one of our moving average values. We will blend this with a series of conditions and introduce various time frames to help us determine:
- Market condition and direction.
- Overbought or oversold conditions.
- Potential turning points or reversal areas.
- A moving average system to determine buy and sell signals.
If you
are looking to improve your skills as a trader, then these next few chapters
will help. I hope I will inspire you to learn how to develop a predetermined
game plan, to act on that plan, and to manage and maintain the profits in the
trade and to learn how and when to cut the trade when the market signals to do
so.
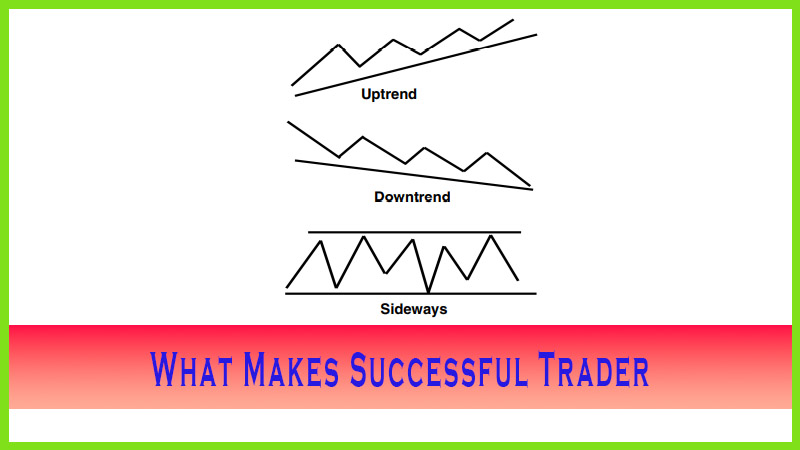
If you
understand the three directions in which a market can go up, down, or
sideways then you will have an edge on learning how to “read the tape,” which
should enable you to cut losses and let your winners ride.
The Candlestick and Pivot Point Trading Triggers : Chapter 2. Determining Market Condition : Tag: Candlestick Trading, Stock Markets, Pivot Point : trading why do gaps get filled, filling gap in stocks, filling gap in forex - Filling in the Gap