Initiating a Trade with Candlestick Pattern
what is a trade summary, How to put order, stop loss analysis, indicates a new trend, Bearish Engulfing signal
Course: [ How To make High Profit In Candlestick Patterns : Chapter 9. Candlestick Stop Loss Strategies ]
A signal has significant meaning. Knowing that, the thought process for when to stop out of a trade becomes easy. A buy signal indicates a new trend. What would counter that “indication”? Being in that trade has favorable odds for profitability, not any guarantees.
Initiating a Trade
A signal
has significant meaning. Knowing that, the thought process for when to stop out
of a trade becomes easy. A buy signal indicates a new trend. What would counter
that “indication”? Being in that trade has favorable odds for profitability,
not any guarantees. Even though a majority of the trades should work from using
the signals, it also means that some trades will not work. Keeping that mindset
in focus, stop loss analysis creates a format for identifying when a trade is
not working and getting out of the trade as soon as possible.
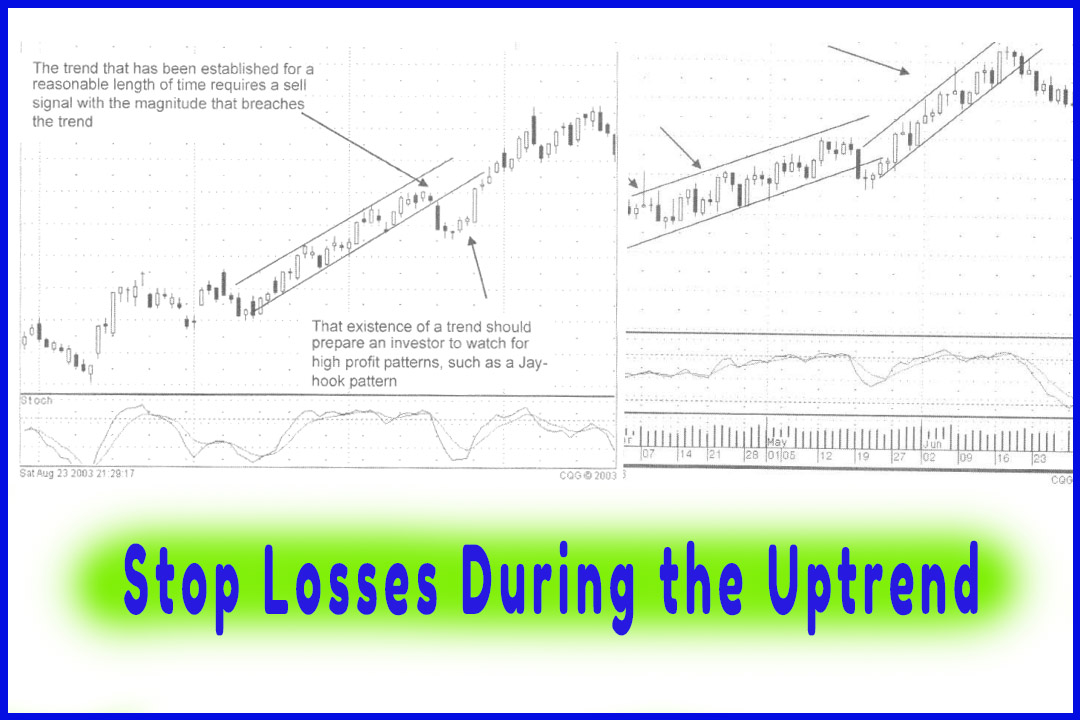
Establishing
the stop loss point is using the same commonsense approach that is incorporated
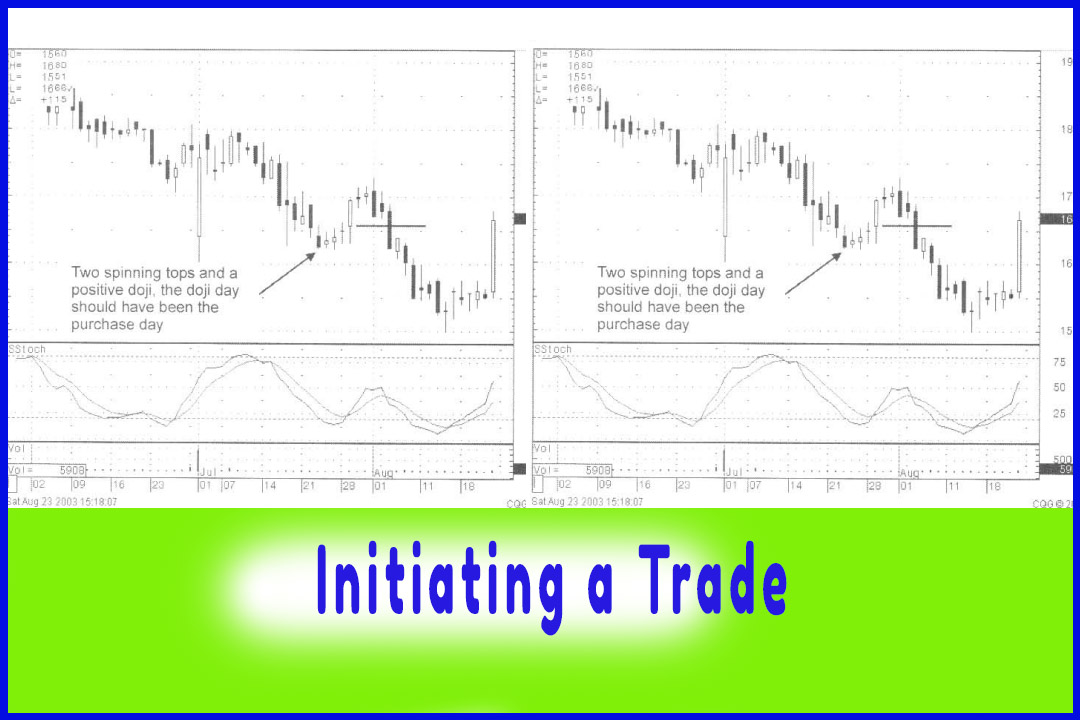
throughout the candlestick method. Examine the chart of Wynn Resorts Ltd. Fig.
10-1. Note the three spinning tops on July 23,24, and 25
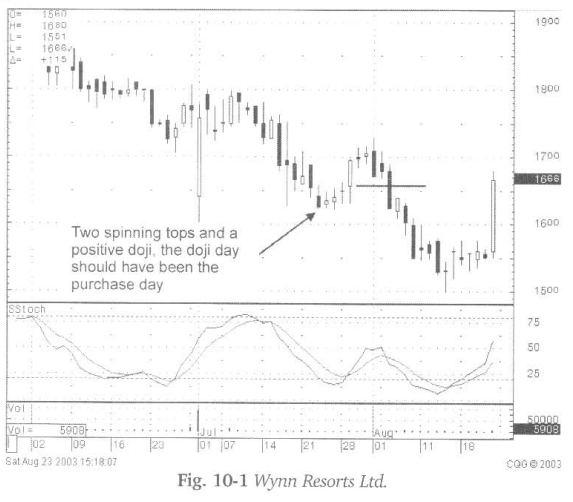
The gap
up on July 28 should have been the buy signal, the entry being at $16.50. A big
bullish candle forms the next day followed by a couple of Doji. The Bearish Engulfing signal the
following day, with stochastics still heading up, may not have convinced
anybody that this uptrend is over. What becomes an obvious level that would
indicate that they were not taking the trend up anymore? That is where a stop
should be placed. The bottom of the large white body on the 29th becomes a
logical level. If the sellers take it back down through that level, the trend
is obviously not ‘up’ anymore.
What does that do for profits? Break even. But
if you can break even on the bad trades, that is not bad at all. Built into the
candlestick trading concept is a factor not evident in most other trading
systems. The signals provide an extra day or so, getting in earlier than the
other technical methods; other technical methods needing more confirmation
than what the candlestick signals provide. Getting in at a more optimal level
makes the sellstop more effective. The negation of a ‘buy’ signal is less
extensive. For example, getting into a position at $10.00, when the $9.50 level
indicates a failure of that trade, is much better than getting in the trade,
using other techniques at $10.70. The failure level, after entering the trade
using a candlestick signal, makes the loss much smaller and less time
consuming.
What are
you expecting to witness after a buy signal? More buying, of course! That
sounds trite but that is exactly what the buy signals should reveal. Note in
Fig. 10-2, the Millennium Pharmaceutical chart, the Bullish Engulfing pattern
on January 23, 2002.
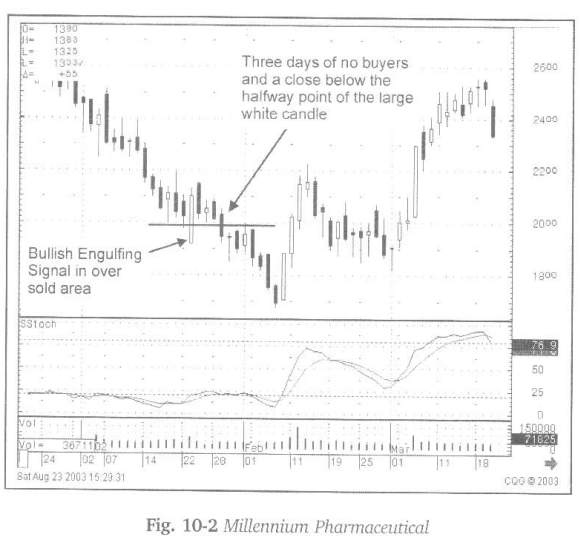
Stochastics
oversold and turning up, and the Bullish Engulfing signal followed by a gap up
open the next day, repressents is the perfect buy scenario. However, as we see,
it closes lower that day. Not disconcerting, it is not unusual to see residue
selling from the previous trend still around. The important point is that a
Bullish Engulfing signal, in an oversold area, has appeared. The following day
a Spinning Top signal, a good sign, the selling of the previous day may have
stopped. The following day begins with a higher open, but then closes lower.
What should now be gleaned from the chart? The obvious, there is no extensive
buying now for three days after the buy signal. Common sense tells us that if a
buy signal occurs, then we should see the buyers continuing the trend.
The
fourth day after the bullish engulfing signal results in a close more than half
way down the Bullish Engulfing candle body. The half-way point of that body
represents an important factor. The sellers are now more evident than the
buyers that formed the white Bullish Engulfing signal. The sellers are
stronger, get out of the trade. Plus it is now four days after the buy signal
and no additional buying has been evident. The trend is not up. Move to a
better trade.
The
half-way point of a body, that created a signal, is the pivotal point.
At that level, the existing trend has negated the new trend indicator. This
works for both directions, bullish and bearish trend reversals. Does that mean
the trade should be ignored? Definitely not! The reason for buying in the first
place was due to a buy signal appearing in oversold conditions. The conditions
have not changed. It is still oversold, and there were buyers that stepped in
once at these levels. If the first entry does not work, keep an eye open for
the next buy signal. That will be stronger because the sellers will see that
even though the sellers overcame the first buying signal, another buy signal
illustrates that new buying is starting again. The sellers usually give up and
get out of the way.
The
halfway point is crucial. As seen in Fig. 10-3, the Kana Communications chart,
the bullish breakout signal indicated new investor sentiment. Trading at the
$3.00 range for six weeks suddenly experiences a new dynamic coming into the
price of the stock. This is a good time to buy. But the next day it backs off.
Should that be a worry? Not really. Remember, it is not unusual to see some
residue selling after a big percentage move. A Harami is formed. At this point
in the new trend, the Harami indicates a day or two of consolidation before the
next leg up.
The next
day continues to back off. However, note the candle formation, a Hammer. That
alone reveals that the buying has started back in. Secondly, notice where it
closes, above the half-way point of the body of the white candle that initially
indicated the new sentiment in the stock. More importantly, that day reveals
the buying has presented itself again. It illustrated that the buyers were
still slightly in control.
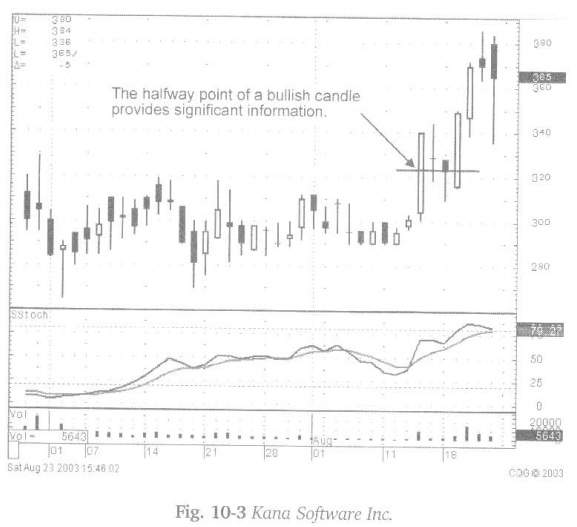
Now the
stop loss decision making process becomes simplified. If the price closes below
the halfway point of the large white candle on the third day after the bullish
candle, it should be obvious that the buyers are not around anymore. The
sellers are a stronger force. Close the trade. On the other hand, the
overriding facet to this trade was that strong bullish candle day. That should
have been evidence that a new attitude was being applied to this stock price.
The direction will persist until there are signals to indicate the direction
has been negated. Expect the ‘probabilities’ to continue the uptrend. As seen
in the chart, the third day showed the buyers continuing what the first big
bullish candle indicated.
To
reiterate, use the half-way point of the bullish candle as the level that would
demonstrate that the buyers were not in control anymore. Also, a buy signal
should represent that the buyers were taking control. After the third day, if
no new buying becomes apparent, that should imply that the buyers are not
around. Take those funds and move to a better “probability” trade.
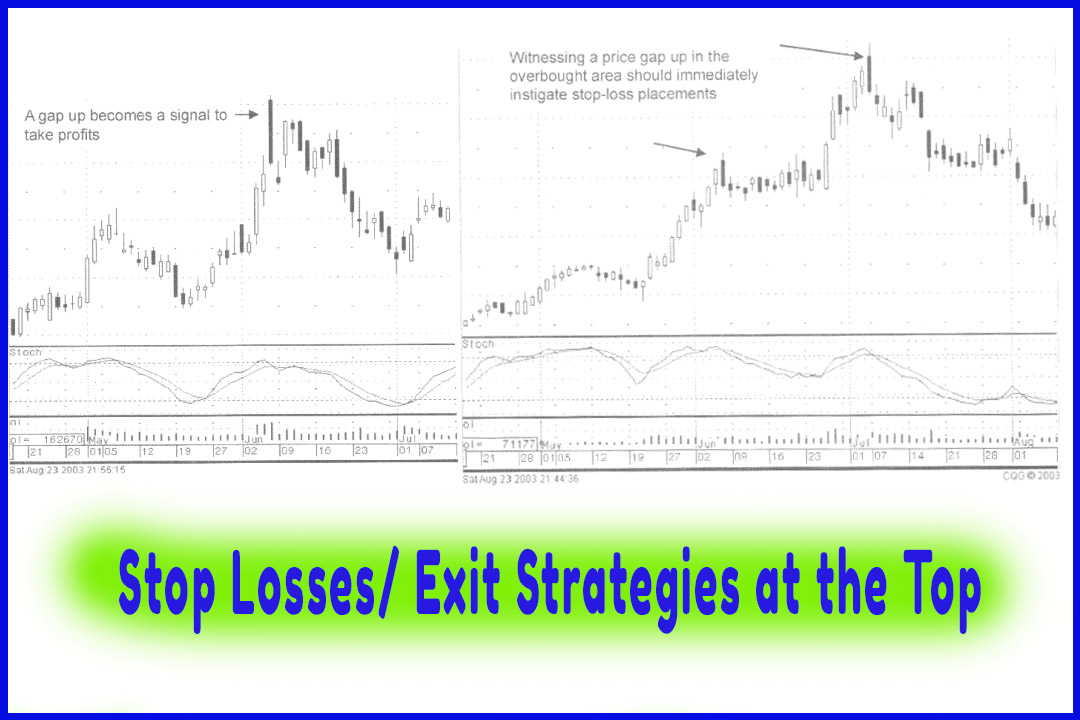
The
Inverted Hammer is an excellent buy signal. Remember the basic rule when
witnessing an Inverted Hammer signal. Seeing the price open positive the
following day, with stochastics in the oversold area, the probabilities are
extremely high this will be a profitable trade. As expected, the trend should
continue upward. With that knowledge, placing a stop becomes very logical. A
positive open indicates that the trend should be up. It will usually continue
up immediately, but if it does close below the open of the previous day, the
bottom of the Inverted Hammers small body, that would indicate that the signal
did not work. Put the ‘sell stop’ at the previous days open price and be ready
to close out immediately
Review
Fig. 10-4, the Kana chart again. June 16, 2003 created the perfect set up for an
Inverted hammer trade. It opened higher that day with stochastics curling up.
This is the exact proper set up for starting an up move from the Inverted
Hammer signal. But there was no follow through in the buying.
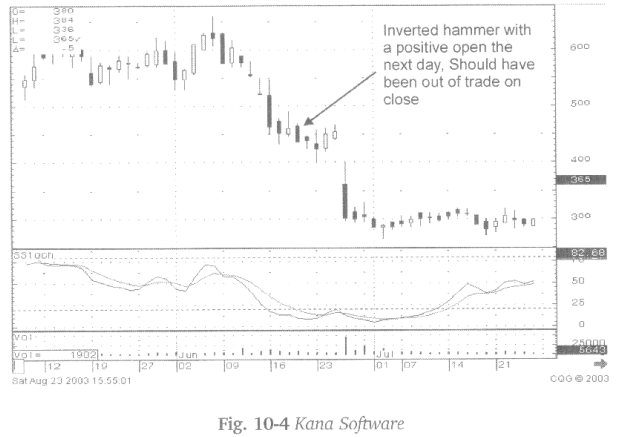
The
price, moving back down through the previous days open, the bottom of the white
body of the Inverted hammer, would be the telling story. The buyers are not
present, as hundreds of years of candlestick charting analysis revealed that
they should be. Breaching that point should be the stop loss level.
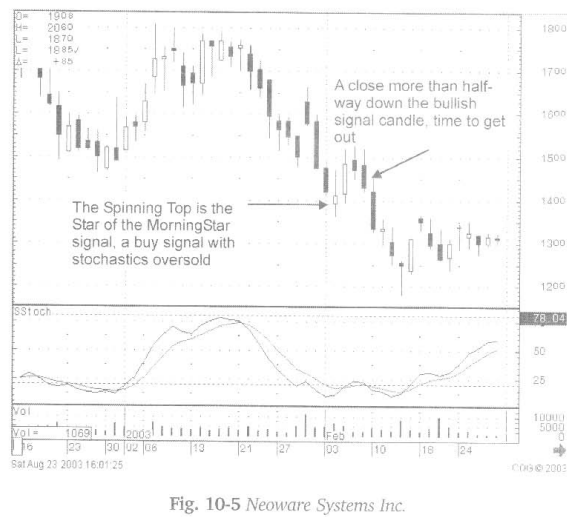
The same
analysis can be seen in Fig. 10-5, the Neoware Systems Inc. chart. The Spinning
Top signal, followed by the bullish candle creates a perfect Morning Star
signal in the oversold stochastics area. Two days after the Morning Star signal,
a black candle closes more than halfway down the white body of the Morning Star
“buy” formation. The sellers are still dominant. Take those funds and move to
a higher probability trade.
The same
rationale can be applied to the Hammer buy signal. To review, upon seeing a
Hammer signal in the oversold stochastics area, with a positive open the next
day, indicates that the buyers are back in the trading. There is a high
probability that the trend has reversed. That given, the trend should be moving
up from that point. Rarely will you see a Hammer in the oversold area, with a
positive open the next day, fizzle and move back down. That is the reason that
we utilize the signal after hundreds of years. The signal discloses that a new
investment sentiment has entered the stock price. However, the operative word
is “rarely”.
This same
scenario should not see a positive open and a close below the body of the
Hammer signal. A close below the body, whether a white or black body, negates
the concept of the bullish implications of the signal. Close the position. As
seen in Fig. 10-6, the Kindred Healthcare stock price, the buy signals are
followed by sell signals. Even what should be considered a strong Doji/Hammer
signal, confirmed the next day with a positive open, immediately shows
weakness. This now becomes a trade that has no follow through buying, not a
trade you want to be in.
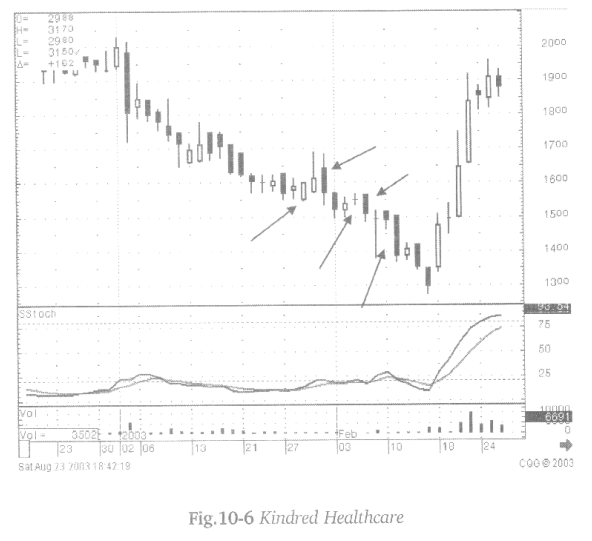
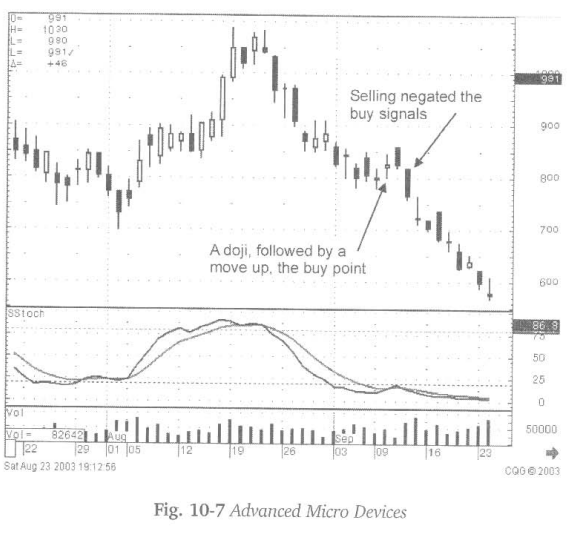
Fig. 10-7
Advanced Micro Devices illustrates a chart pattern dial set up with a Doji at
the bottom. Followed the next day with a positive open, a strong buy indicator.
Even the next day it gapped open to the upside. But it traded lower from that
point, creating a black candle. The black candle, three days after that Doji,
becomes a significant indicator. The close, being lower than the Doji that
first indicated the reversal to the upside, now reveals that the sellers have
overpowered the buyers. Not a position that represents buying anymore. A bad
trade? Close it and move those funds to a strong chart.
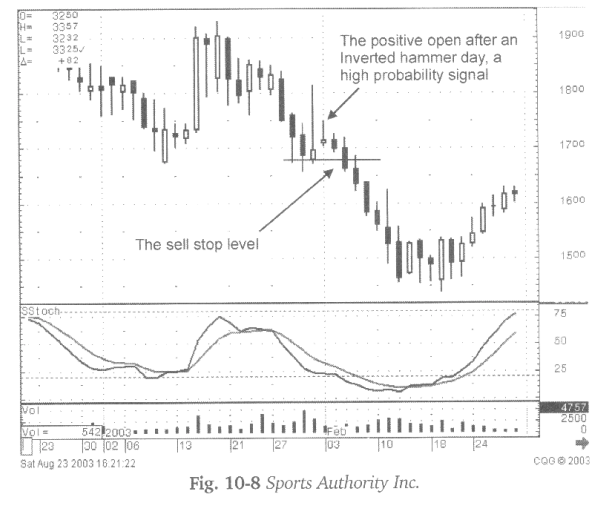
Illustrated
in Fig. 10-8, the Sports Authority Inc. chart is another Inverted Hammer that
is set up exactly as it should for producing a profitable trade. The
stochastics nearing the oversold area and a strong Inverted hammer should have
prepared the candlestick investor for an opportunity the next day. That
opportunity would have presented itself by revealing a positive open after the
Inverted hammer signal. Buying on the open that next day was the right execution.
The little selling day after that did not change the direction of the trend.
However, the fact that the sellers could push the price back down through the
body of the Inverted Hammer gave a clear indication that the sellers had overpowered
the buyers.
As
illustrated in the chart examples, the basis for proper stop loss levels, using
candlestick analysis, boils down to one simple observation, what level demonstrates
more sellers than buyers. That revelation can occur the next day or after three
days or more. If no new buying has come into the stock price, the buy signal is
not being confirmed. Take those funds and move to a chart that shows buyers.
Does that
mean that trade is dead? No. Watch it. It has already been evaluated as being
oversold. The buyers may still be ready to buy in at that price level. Again,
the next buy signal will reveal that the buyers are back again. This same
message will be noticed by the sellers. They may start backing away from their
selling or start covering their shorts.
How To make High Profit In Candlestick Patterns : Chapter 9. Candlestick Stop Loss Strategies : Tag: Candlestick Pattern Trading, Option Trading : what is a trade summary, How to put order, stop loss analysis, indicates a new trend, Bearish Engulfing signal - Initiating a Trade with Candlestick Pattern