Stop Losses During the Uptrend
How to put stoploss, how to put uptrend stoploss, how to put a stop loss on a put option, candlestick analysis, longer-term position holder, price broke the trend lines
Course: [ How To make High Profit In Candlestick Patterns : Chapter 9. Candlestick Stop Loss Strategies ]
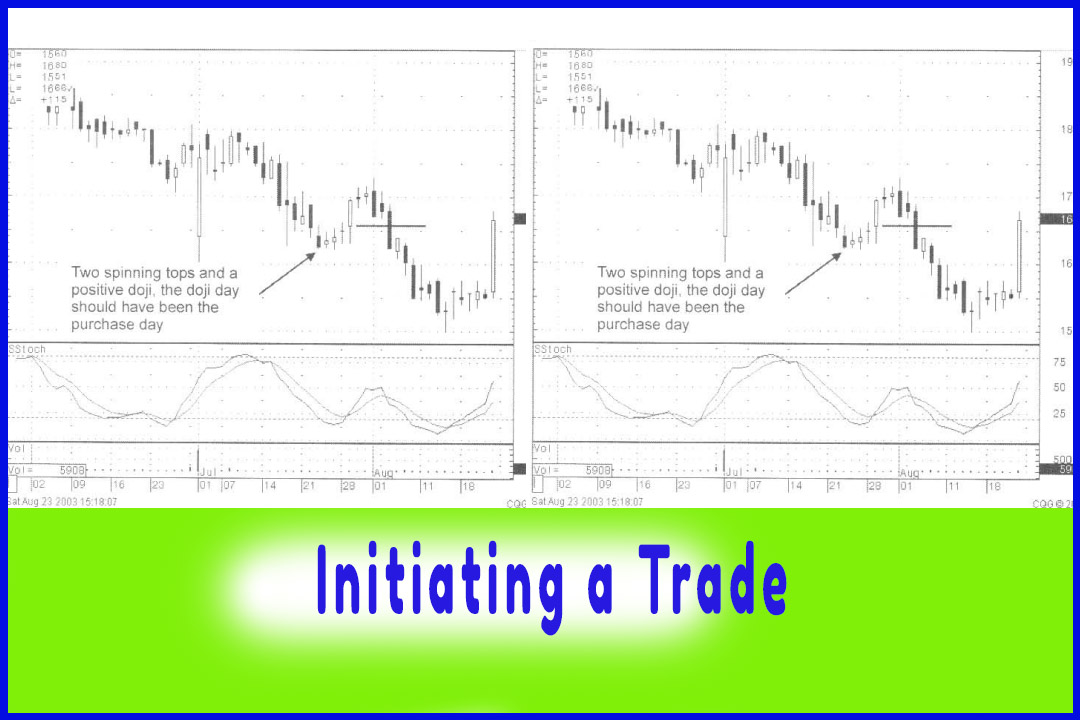
The next strategy to consider is, “what should be done when the uptrend has started.” This again incorporates commonsense planning.
Stop Losses During the Uptrend
The
previous examples were illustrating stop loss reasoning in the initiation of a
trade. The next strategy to consider is, “what should be done when the uptrend has started.”
This again incorporates commonsense planning. Back to the basics, what does
the candlestick buy signal represent? It is the change of investor sentiment,
the “trend” should be up. Does a trend go straight up? As much as we would like
it to, there will be zigs and zags in tire price movement. The only reason for
putting a stop loss on, during a good trending situation, is to protect
yourself from that rare catastrophic announcement. Otherwise a stop loss, too
close to the price oscillations, could stop you out at a low point of an up-
trending trade.
Once the
trend starts, candlestick analysis can be applied. The same thinking process
can be used for evaluating whether a trade is still working or not. A price
level can be predetermined as to where it would be indicating that the sellers
have taken control. During an uptrend, more latitude can be given. The longer
the uptrend continues, the more definite a ‘sell’ signal needs to be to reveal
that the trend has terminated.
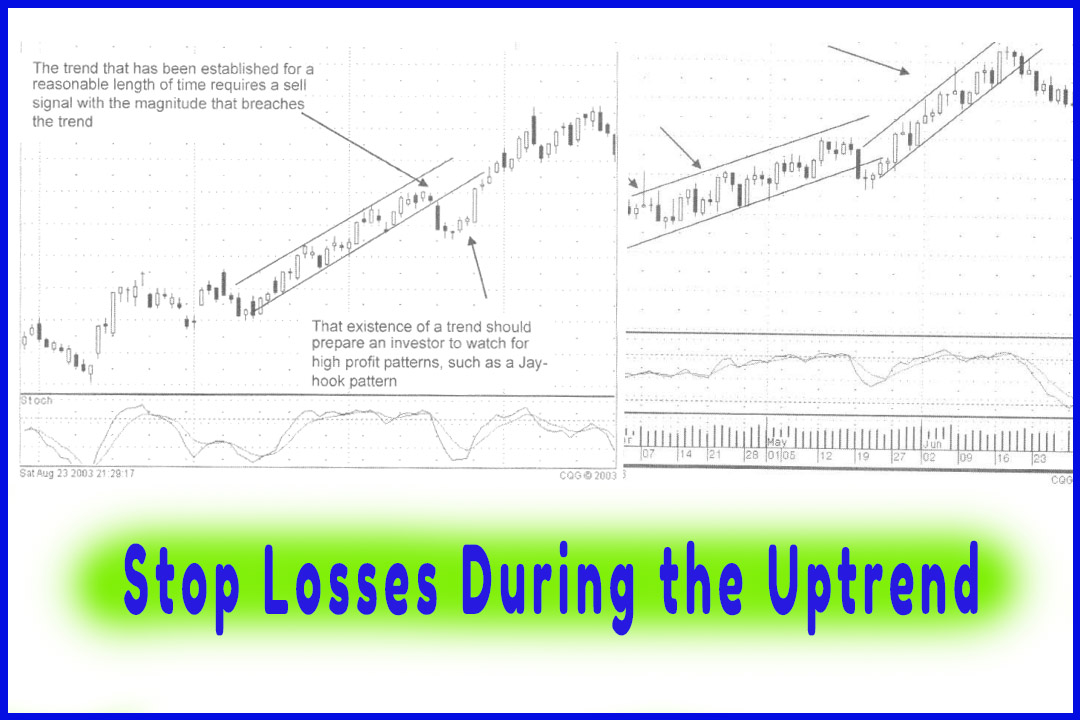
Note in
Fig. 10-9, the NASDAQ chart the trend was apparent until the gap down in price
broke the trend lines.
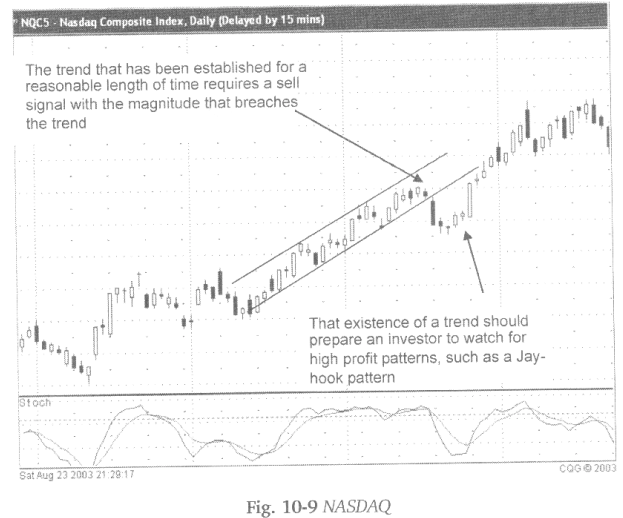
Since
March 10, 2003, the NASDAQ chart has shown a steady uptrend. These trends would
continue for a month and a half at a time. Upon closer observation, it will be
seen that there were definite sell signals in those periods. Does that diminish
the validity of the signals? No, the signals need to be heeded. However, they
need to be evaluated based upon the environment that they are being viewed.
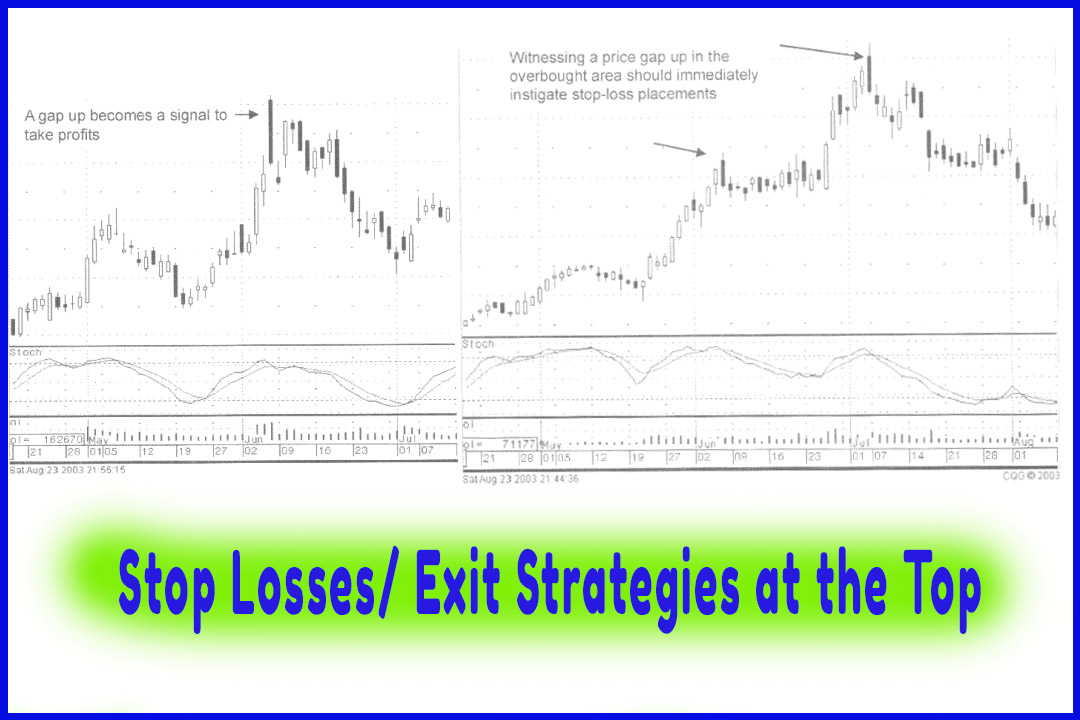
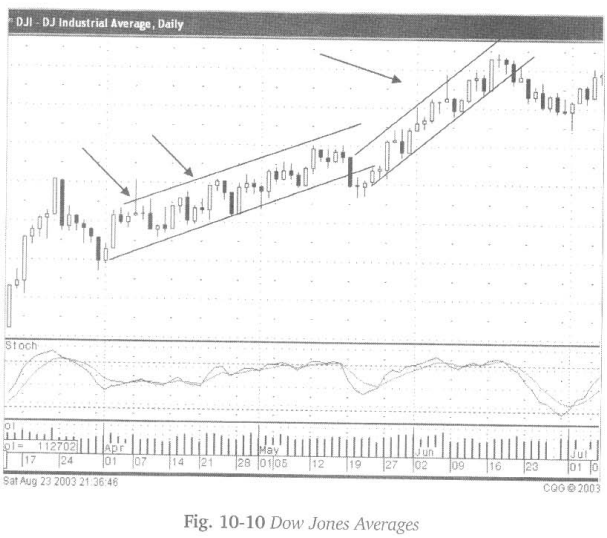
As seen
in Fig. 10-10, the DOW chart, the signals divulge selling at the top of the
trend channel. That provides valuable information. For the short-term trader,
it becomes evident that the upside channel is not going to be breached. Individual
stock charts may have already produced a strong run up. The charts showing
toppy signals can be liquidated. Why own a stock that appears to have great
probabilities of going back down? Take profits! Positions can always be bought
back when sell signals are negated.
Will the
stocks with toppy chart patterns be finished as far as further upside? That can
be determined by seeing what the next down move will do. Observation reveals
that for the past few weeks, the pullbacks have been supported by the bottom channel
trendline.
If not as
aggressive a trade, the longer-term position holder can sit through a pullback,
using the bottom of the trend channel as a guide, alleviating the need for
bopping in and out of a trade.
Note the
third week in May; the bottom of the trend channel is breached, occurring about
three months after the start of the uptrend. Not a bullish sign. Take some
profits. But keep in the back of your mind that a strong reversal signal is
required to change the trend. The longer the trend, the more powerful the
reversal has to be demonstrated. That is a function of the investment psychology
in the markets. The longer a trend continues the more compelling a sell signal
needs to be to show investors that the trend is finally over. The optimistic
(or pessimistic) attitudes that are being ingrained during the trend are hard
to dispel as the direction of the trend changes.
Further
analysis of the NASDAQ chart shows that the selling that broke through the
bottom of the trend immediately stopped with the appearance of a couple small
hammers, and then continued buying. Other technical analysis would have
evaluated this as consolidation in the beginning of a downtrend. The
Candlestick analyst has the benefit of visually seeing that buying is occurring,
stochastics at the bottom, curling up. Instead of a full fledged selling
program, the candlestick investor would be watching to see if continued
strength was coming back into the market.
Would a
sell stop have been prudent when the trading breached the lower trend channel?
The “probabilities” indicated that the sellers were taking control. However,
the individual stock positions should have been evaluated as to what their
chart signals indicated. This would have eliminated a mass selling spree.
Seeing the hammers, after the bottom of the trend channel was breached, gave a
forbodence of the downtrend not being a powerful move. If stopped out, it was
probably done in positions that had good profits from the preceding uptrend.
That does not preclude an investor from getting right back in to the same
positions after they have consolidated and started moving back up. Better yet,
those funds could be moved to new sectors/positions that were coming out of
oversold conditions, with much greater upside potential and lower downside
risk.
How To make High Profit In Candlestick Patterns : Chapter 9. Candlestick Stop Loss Strategies : Tag: Candlestick Pattern Trading, Option Trading : How to put stoploss, how to put uptrend stoploss, how to put a stop loss on a put option, candlestick analysis, longer-term position holder, price broke the trend lines - Stop Losses During the Uptrend