Candlestick Stop Loss Strategies
How to put Stoploss, How to find stoploss, which is better stop loss or trailing stop loss, candlestick pattern stop loss, candlestick stop loss techniques, what is the meaning of stop loss in trading
Course: [ How To make High Profit In Candlestick Patterns : Chapter 9. Candlestick Stop Loss Strategies ]
Protecting your assets is the main function of putting on stop losses. It is to provide a point where the reason for “buying” becomes null and void. Many trading strategies incorporate them into their trading formulas for closing a trade that has gone sour.
Candlestick Stop Loss Strategies
“Progress always involves risk; you cannot steal second base and
keep your foot on first.”
Protecting
your assets is the main function of putting on stop losses. It is to provide a
point where the reason for “buying” becomes null and void. Many trading
strategies incorporate them into their trading formulas for closing a trade
that has gone sour. Usually this is done by establishing a percentage loss as the
parameter. The Candlestick method completely disregards a preset formula for
stopping out.
There is
a major flaw in using a prescribed percentage loss as the stop loss. Your
purchase price becomes an important function of where you are to stop out. Some
investment advisors recommend three percent as the stop out level. Others
suggest eight percent. But where you buy a trade position now becomes the
quantitative element of where you should place your stop. A couple of extreme
disadvantages become apparent.
A buy
recommendation is placed on a stock. You are advised to place a stop at a
preset number, for example, three percent below your entry price. The buy is
placed on a stock at $50.00. However, by the time you get executed, you have
paid $50.80. Buying the stock at $50.00 would have meant your stop out level
was $48.50. Your entry at $50.80 now means that the stop loss is to be placed
at $49.27. As often mentioned in candlestick analysis, where you bought a stock
or sell a stock does not mean a hill a beans to the market. Your arbitrary
level of where to come out of a trade has absolutely nothing to do with what
the price trend should be doing. What if $48.50 is a level that negates the
uptrend move, but $49.27 does not change the trend direction.
Your entry
level, although may not have been the ultimate point to get in, does noy have
anything to do with what the trend is doing. Prices coming back down through
S49.27 may not be a level that affected the uptrend. The “percentage stop” may have stopped you out
while the trend direction was still valid.
“Everything comes to he who hustles while he waits.”
Additionally,
the volatility of a particular stock has a great bearing on whether a trend has
been affected. A three percent pullback on some stocks might be more than big
enough to reverse a trend, while a ten percent move in others stocks is common
and isn’t a factor on the trend direction.
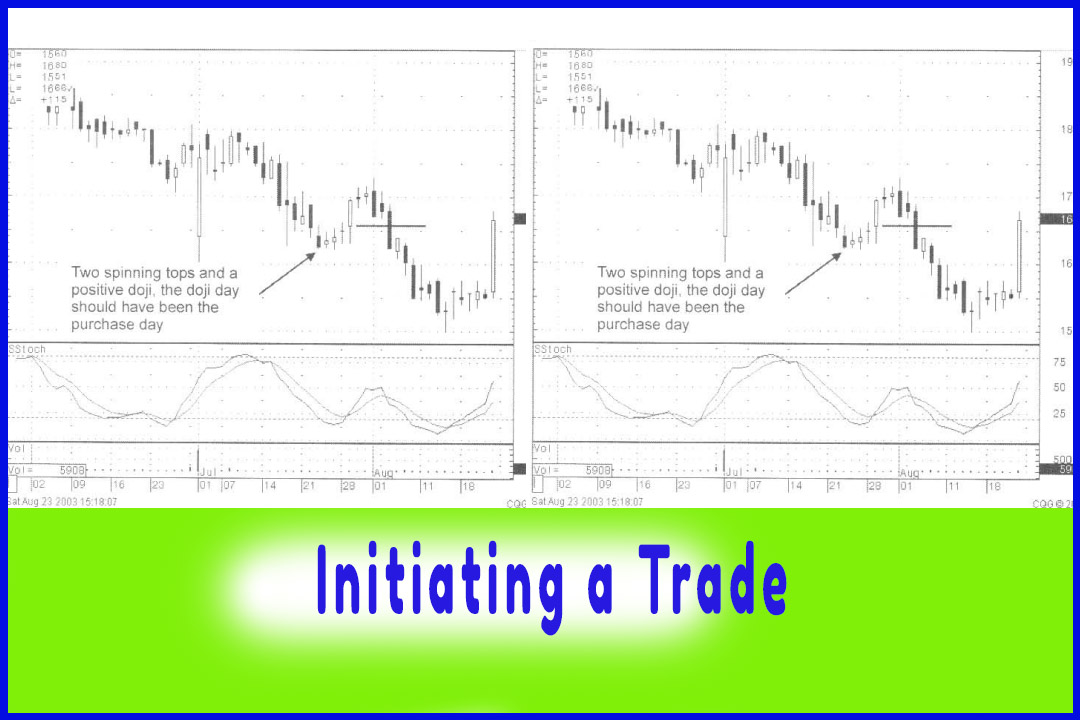
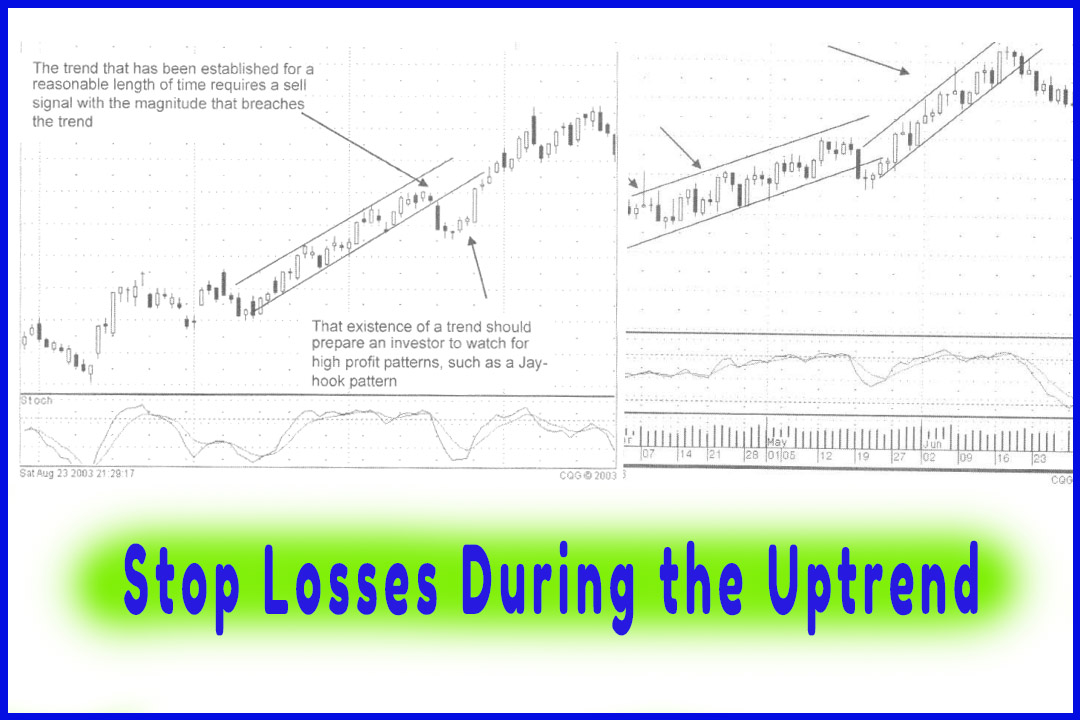
The most
important factor for establishing a stop loss is very basic. What price point
would indicate drat the established trend has been negated? This now becomes a
stop loss level that is established based upon the trend being stalled and/or
negated. As with all of Candlestick analysis, this becomes a “common - sense” evaluation. If you have
put on a long position, based upon a bullish buy signal, where would the price
have to pull back in order to confirm that tire sellers were still in control?
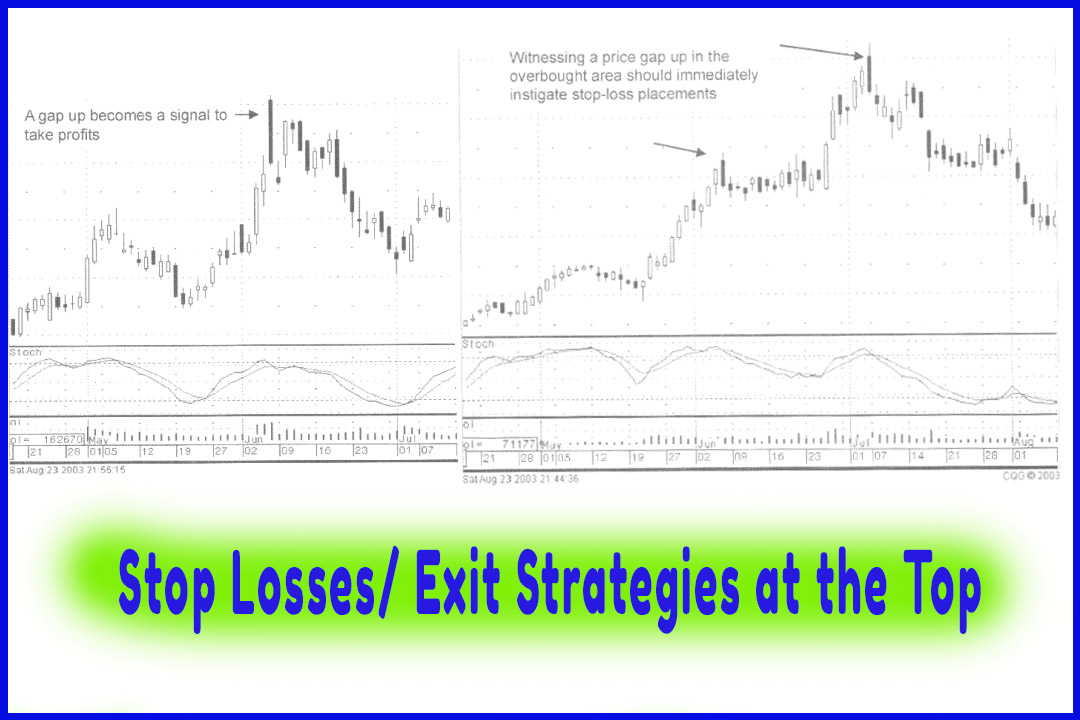
The
simple visual evaluation establishes the proper stop loss point as it pertains
to that specific stock position, taking into consideration the volatility of
the stock and the signal that created the buy signal. A stop loss on one stock
may be relevant at a close level whereas the next stock position requires
greater latitude. Candlestick analysis allows the investor to establish a stop
loss that would logically indicate when the sellers were still in control, and
the buyers have been overcome.
How To make High Profit In Candlestick Patterns : Chapter 9. Candlestick Stop Loss Strategies : Tag: Candlestick Pattern Trading, Option Trading : How to put Stoploss, How to find stoploss, which is better stop loss or trailing stop loss, candlestick pattern stop loss, candlestick stop loss techniques, what is the meaning of stop loss in trading - Candlestick Stop Loss Strategies