Stop Losses/ Exit Strategies at the Top
How to exit before stoploss, where placing stops, simple stoploss strategy, effective trading strategy
Course: [ How To make High Profit In Candlestick Patterns : Chapter 9. Candlestick Stop Loss Strategies ]
The other major concern for most investors is where does one start trying to protect profits. The easy answer is, “when you start witnessing sell signals.” That should be the ultimate method.
Stop Losses/ Exit Strategies at the Top
The other
major concern for most investors is where does one start trying to protect
profits. The easy answer is, “when you start
witnessing sell signals.” That should be the ultimate
method. But that does not work for all investors. If the trades cannot be
watched at the beginning of trading or the end of each day's trading, a problem
that most working investors face, then a stop-loss strategy can be implemented
that protects most of the profits. The phrase
“most of the profits” has a significance.
Our ego’s
have a severe deterrent for allowing us to make money. The majority' of
investors feel drat a trend needs to be bought at the very bottom and sold at
the very top. To take profits before a trend peaks out or after the high has
been seen is a blow to the ego. “Why didn’t I get out when it was a point
and a half higher?” the question always asked with a tinge of anguish in
the voice. A defeat to the ego if that trade was not maximized to the hilt. The
point to maximizing profits is not to maximize the profits from each trade. It
is to maximize the profits in the account. Two completely different objectives!
The
aspects of the ‘built in’ psychology behind the signals produce immense
advantages. Knowing what the normal investor flaws occur in investment actions
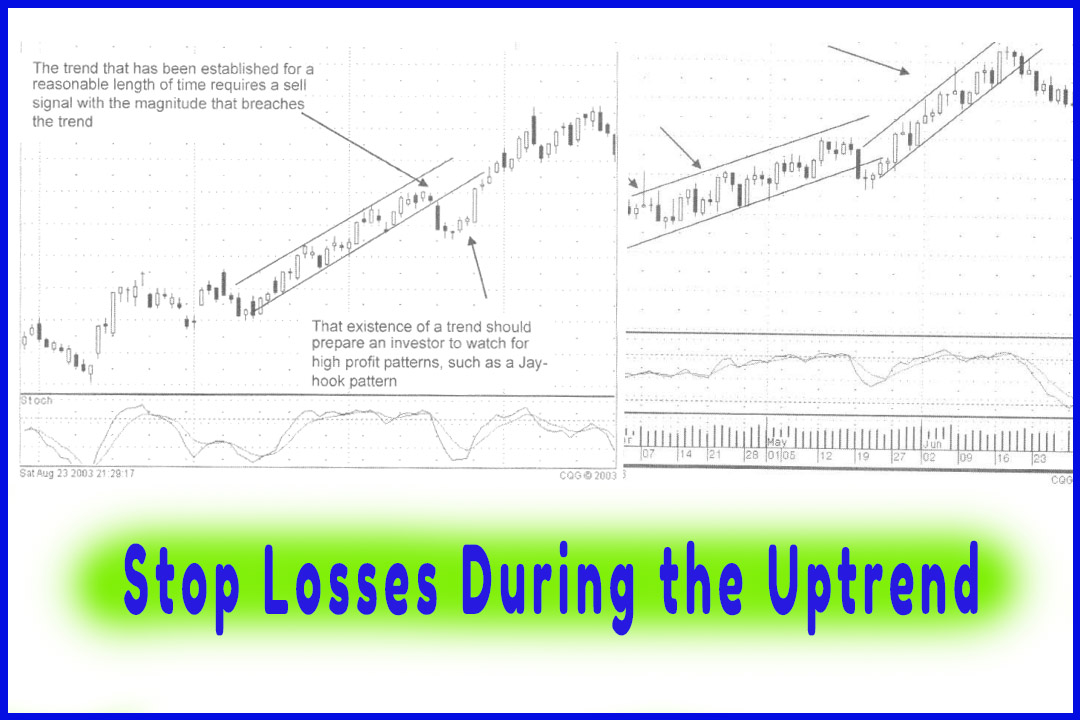
provides an effective trading strategy Placing stop-losses, based on where a
price should not move back to in an uptrend, becomes an easy function. The
depiction of human emotions is charted in the price action of the trend. To
reiterate, the average investor panic sells at the bottom and is an exuberant
buyer at the top. Knowing this (and probably having experience with those flaws
in our own previous investing habits) the candlestick investor can be prepped
for when a sell signal should be occurring.
What do
we see at the top of the trend? Exuberant buying! Buying that is usually shown
as larger white bodied candles after an extensive uptrend. Or, a gap up at the
top. Being armed with that knowledge permits the candlestick investor to
extract a high amount of profit from a trade.
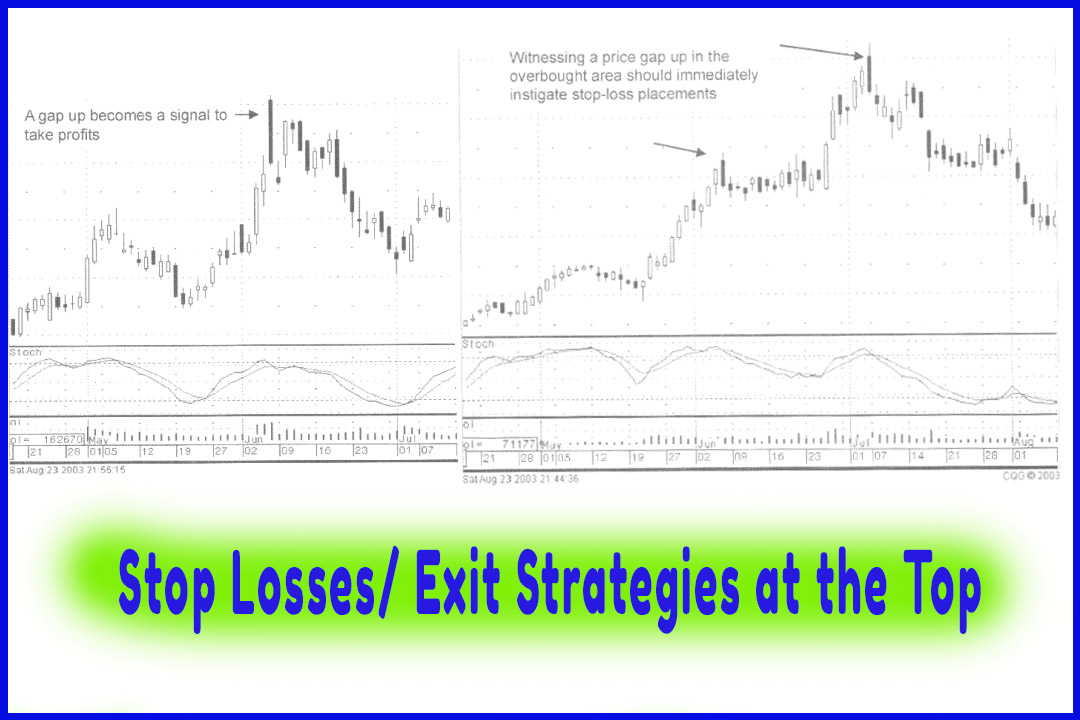
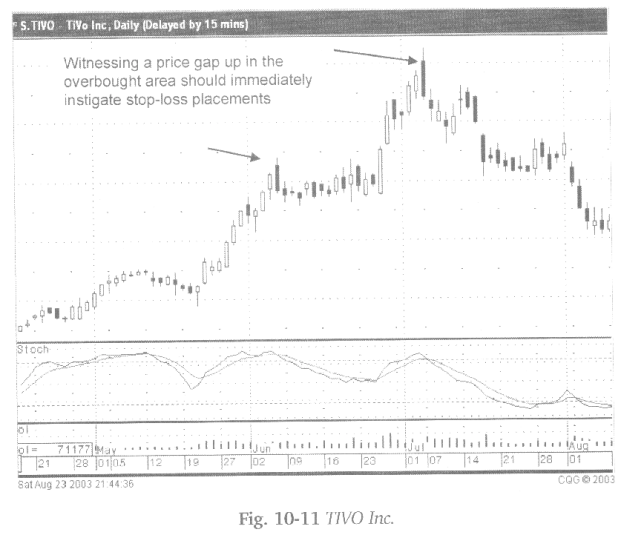
As seen
in Fig. 10-11, the Tivo chart, the gap up when the stochastics were peaking out
indicated that the exuberance had culminated. The gap up was the signal. What
is the best way to exit from this trade? First, the gap at the top is the sign
to be ready to sell. A couple of simple stop-loss applications make getting out
of a trade an easy mechanical procedure. When the price gaps open in the
overbought area, a few things can occur. The price can continue to go up from
that point. The price can stay the same, or it can go down. Undoubtedly, these
are not earth moving revelations. Fortunately, dissecting what each will do, as
far as a candlestick signal indicates produces an easy-to-execute exit
strategy. This is where placing stops becomes an excellent mechanical process.
If the
price gaps up, the first action should be to place a sell stop at the previous
day’s close. If the price gaps up and immediately shows strength, moving
higher, place a sell stop at the opening price. What is the rationale behind
these moves?
Consider
what signals will be created after a gap up move. Closing at or below the open
now produces a Shooting Star signal or a Doji/Shooting Star, both sell signals.
Even a close slightly above that day’s open will produce a Shooting Star. A
close back at the previous day’s close will form a Meeting Line signal. A close
half-way down the previous white body produces a Dark Cloud signal. A close
below the previous day’s ‘open’ produces a Bearish Engulfing pattern. All sell
signals.
If tire
price gaps up, the first procedure is to put a sell stop at the previous day’s
close. If prices immediately back off from the open price and the ‘stop’ is
executed, the probabilities indicate that the majority of the profits have been
extracted from a trend.
If the
price opens higher and continues to move higher, moving the stop up to opening
price becomes more advantageous. If the price moves up, then back down through
the open price, the probabilities lean toward a candlestick sell signal
forming.
The only
bullish scenario that can occur after the price was up and came back down
through the open would be to turn around and have the price move back up
substantially. Substantially, being far enough up not to create a Hanging Man
signal. A gap up at the top, whether it opens and continues higher or it opens
and immediately retraces, has many more sell signal opportunities versus the
continuation of the uptrend. Back to a basic premise, maximize profits for the
account. A gap up at the top is now a high probability profit-taking
situation. Be ready to move the funds elsewhere.
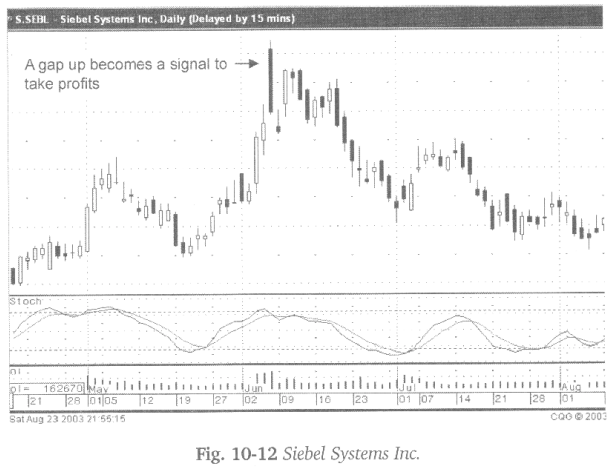
Fig.
10-12, Siebel Software is another example of the gap up at the top. A sell stop
at the open would have provided a very profitable execution. Not all trades
will give you time to place the order at the open price, if upon opening, it immediately
moves up and quickly falls back. Tire next safe stop is at the last white
candle close, which in this case did not get executed until the following day.
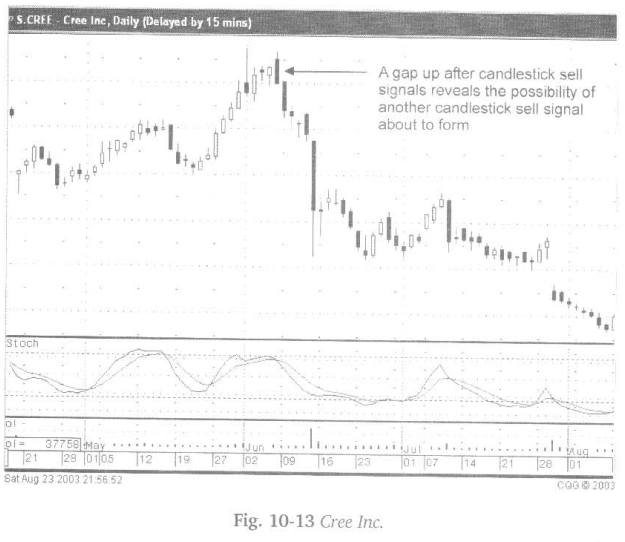
Fig,
10-13, Cree Inc’s chart illustrates another example of the open or the previous
closing price becoming the best strategy point for placing a sell stop. This
chart reveals the warning signal four days earlier, a Shooting Star. It would
have taken a huge up move, after pulling back through those levels, to eliminate
the possibilities of a sell signal forming. Upon seeing the stochastics in the
overbought range and a gap up at the top of the mend, get out. Why try to buck
the odds. Take the profits and go to a low risk, high probability trade.
How To make High Profit In Candlestick Patterns : Chapter 9. Candlestick Stop Loss Strategies : Tag: Candlestick Pattern Trading, Option Trading : How to exit before stoploss, where placing stops, simple stoploss strategy, effective trading strategy - Stop Losses/ Exit Strategies at the Top