Candlestick Warnings to Exit a Swing Trade
short-term trade, Exit a Swing Trade, Candlestick Warnings, candlestick reversal patterns, Bearish Engulfing Patterns
Course: [ How To make High Profit In Candlestick Patterns : Chapter 7. Profitable Trading Insights ]
One-way traders can gain an edge is to recognize a timely sell signal that warns that the swing up is probably over. That’s where Candlestick charting can be very helpful.
Candlestick Warnings to Exit a Swing Trade
One-way
traders can gain an edge is to recognize a timely sell signal that warns that
the swing up is probably over. That’s where Candlestick charting can be very
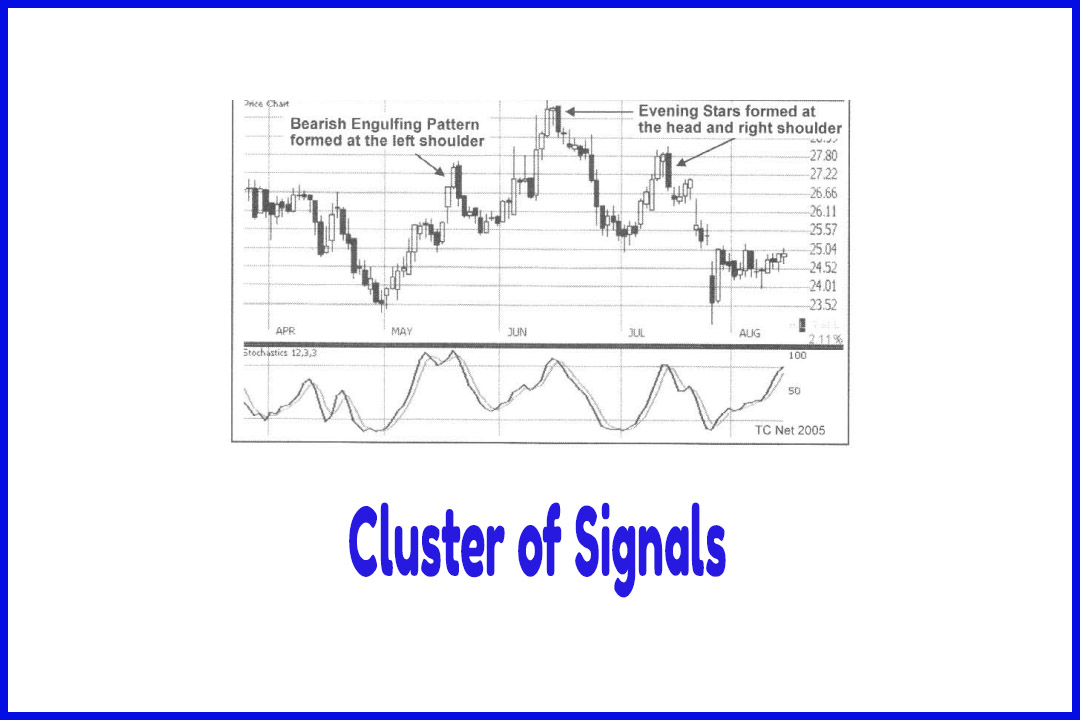
helpful. One type of warning traders may see, at or near a swing high, is one
of the many bearish candlestick reversal patterns. These patterns can inform
traders that price may be about to pull back. With some reversal patterns, by
the time the pattern can be identified, it is too late. Once the pattern becomes
apparent, the pullback is already beginning and the gains from the swing trade
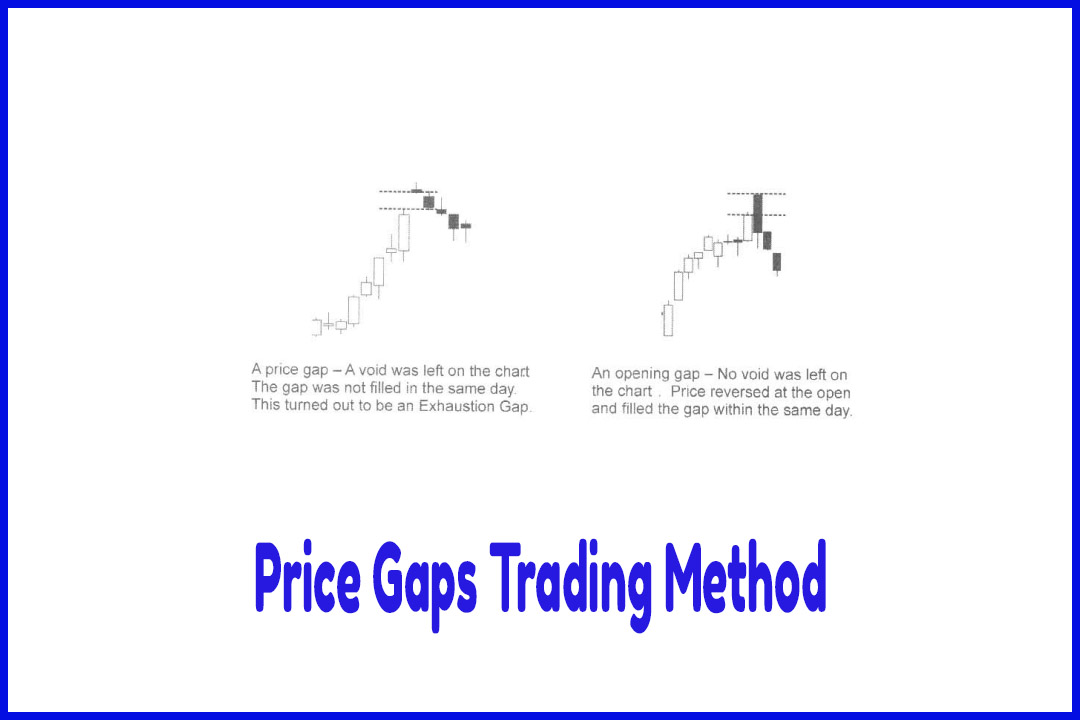
are slipping away. The Dark Cloud Cover and Bearish Counterattack (Meeting)
Line patterns both start out as an opening gap. Some, but not all, Bearish
Engulfing Patterns also start as an opening gap.
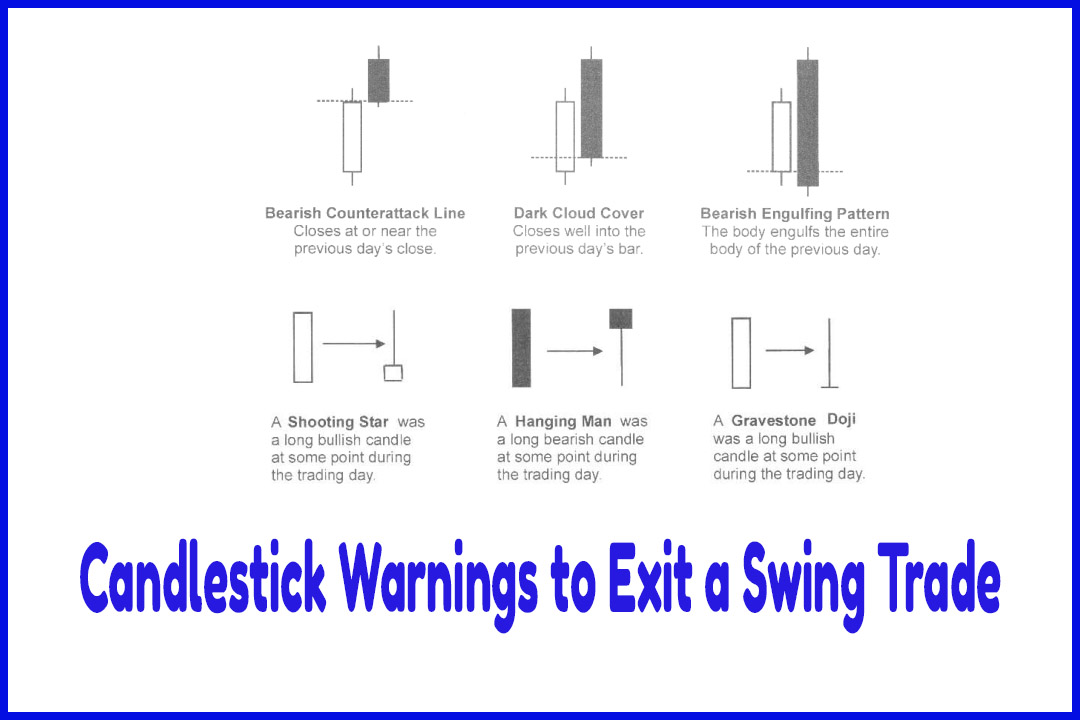
Fig 8.14
illustrates these three bearish pattern. The difference between the patterns is
the depth of which the bearish candlestick intrudes into the previous day’s
bullish candle. The deeper the bearish candle, the further price is into a
pullback by the close of the bar.
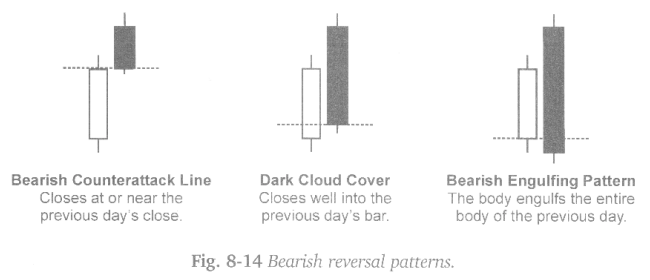
The
Bearish Counterattack Line stops at, or near, the previous day’s close. The
additional gains that could have been locked in at the open are erased. The
Dark Cloud Cover is more ominous. It closes more than midway down the body of
the previous day's bullish candle. The additional gains at the open, plus most
of the previous day’s gains, are erased. The Bearish Engulfing Pattern engulfs
the entire body of the bullish candle. It erases even more of the gains than
the other two patterns.
For a
swing down, the inverse of the patterns mentioned above are the Piercing
Pattern, the Bullish Counterattack Line and the Bullish Engulfing Pattern. In
most instances, when price gaps up after an advance, or gaps down after a
decline, exiting at the open is the best strategy for a short-term trade. Waiting
until the end of the day to exit would result in a less profitable trade. It is
true that traders cannot know for sure until the close of trading how the end
of day bar will look. However, because of the likelihood of an opening gap
filling within the same day, they can anticipate that the bar will probably end
the day bearish.
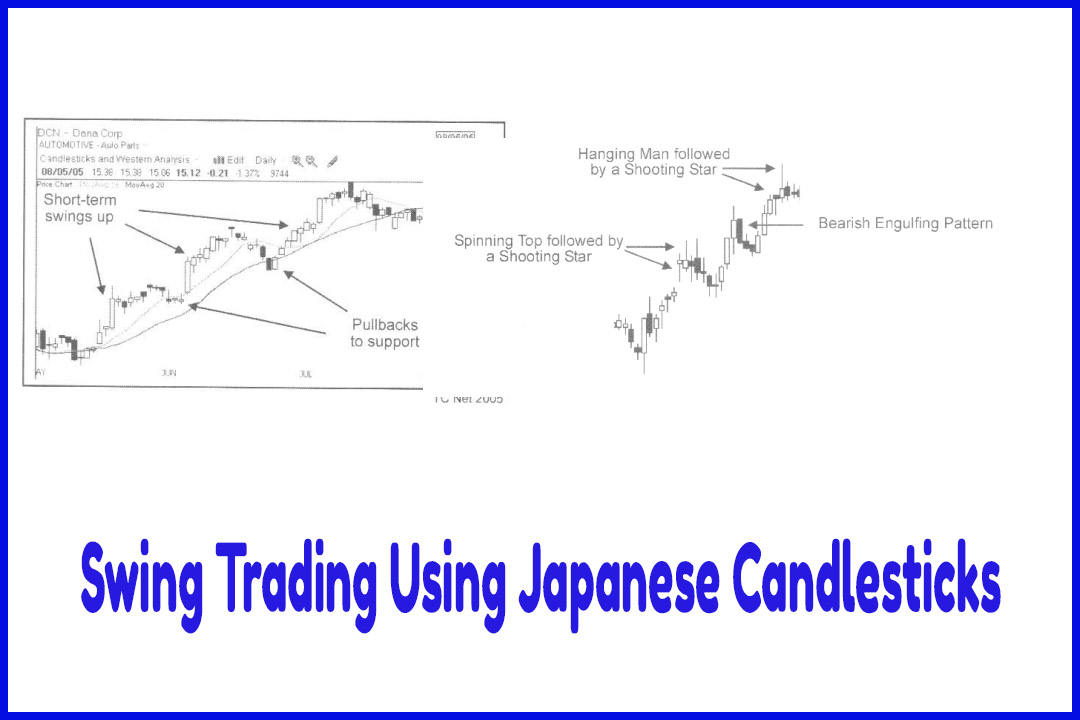
Many
Hanging Man patterns also start as an opening gap and can be exited at the
open. By the close, a trader can look back on this pattern and realize that
having sold at the open would meant not having held through the decline that
formed the long black candle. With this pattern, price does rise back up and
closes near the high by the end of day. However, the trader has to watch a
considerable amount of their profits disappear intraday before price turns back
up. Many traders may end up closing out the trade before price turns back up.
They could just sell the opening gap and avoid the roller coaster ride.
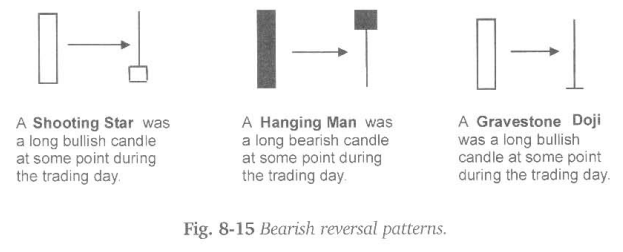
There are
other bearish reversal candlestick patterns that may not gap up at the open,
but by the close of the bar, it becomes apparent that the opportunity to sell
near the swing high was missed. For example, on those reversal patterns that
have long upper shadows, such as the Shooting Star or a Gravestone Doji.
Wherever an upper shadow remains, the candle was one a bullish body that traded
up to the high of the shadow. Vice versa for a lower shadow.
It is
always easy to look back on a chart and wish you had sold at a higher price.
These patterns aren’t as easy to anticipate as those that gap up at the end of
a swing. However, sometimes they can be excited with more profit if a target
has been calculated in advance. For instance, if there is ovethead resistance
on the chart, a target can be set for a bit below that resistance level.
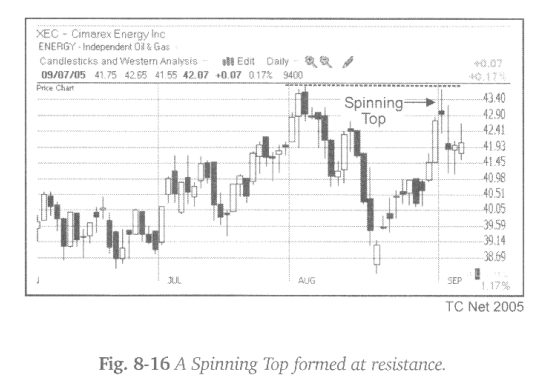
Figure
8-16 is an example where a sell limit order could have been placed in
anticipation of the resistance being tested. The sell order, set for just below
the ceiling, would have triggered while the candle was still bullish. By the
close, the candle had formed a Spinning Top and pulled back more the following
day.
How To make High Profit In Candlestick Patterns : Chapter 7. Profitable Trading Insights : Tag: Candlestick Pattern Trading, Option Trading : short-term trade, Exit a Swing Trade, Candlestick Warnings, candlestick reversal patterns, Bearish Engulfing Patterns - Candlestick Warnings to Exit a Swing Trade