Cluster of Signals
option trading guidelines, option trading requirements, option trading good for beginners, best option stocks for beginners
Course: [ How To make High Profit In Candlestick Patterns : Chapter 7. Profitable Trading Insights ]
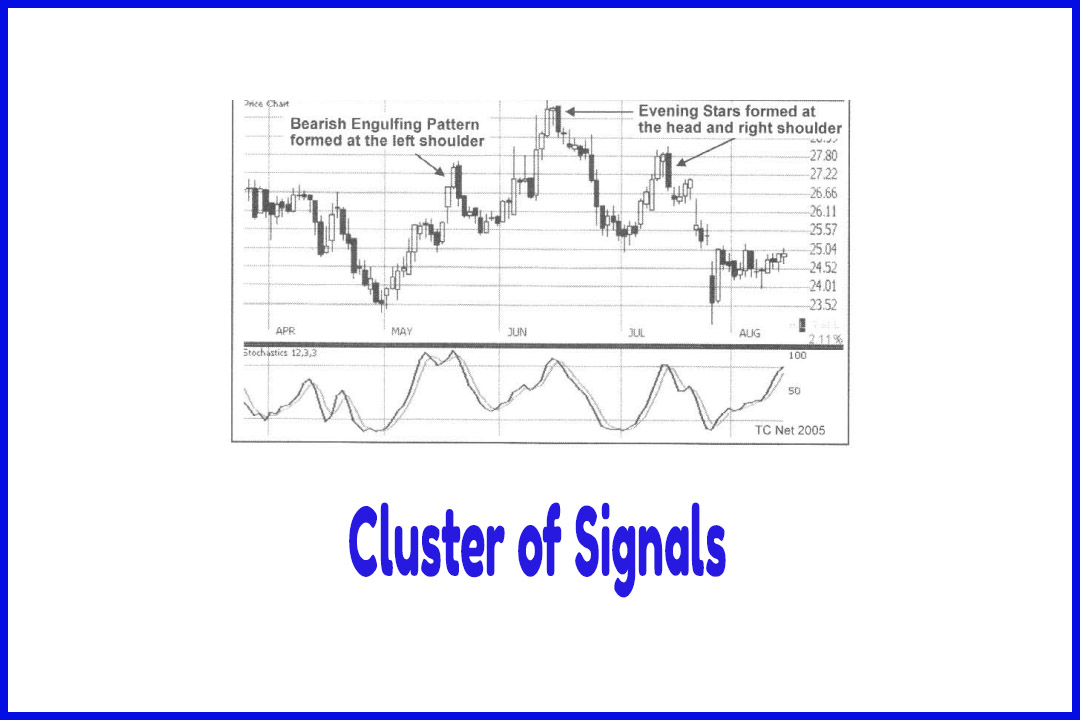
Often more than one reversal signal occurs near the same price level. Multiple signals clustered together should give a trader more confidence that the set-up will follow through in the anticipated direction.
Cluster
of Signals
Often
more than one reversal signal occurs near the same price level. Multiple
signals clustered together should give a trader more confidence that the set-up
will follow through in the anticipated direction. An example would be when a
Japanese candlestick pattern forms within a larger western chart pattern. For
instance, often the second top of a bearish Double Top is a bearish candlestick
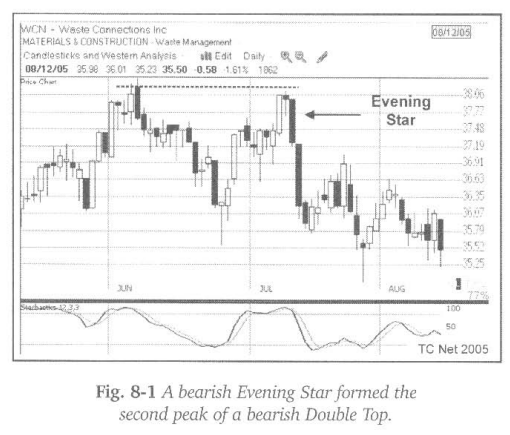
reversal pattern. Figure 8-1 shows a Double Top that formed on the Waste
Connections chart during the summer of 2005. An Evening Star formed at the
second peak of the larger pattern. Stochastics confirmed by turning down from
the oversold line.
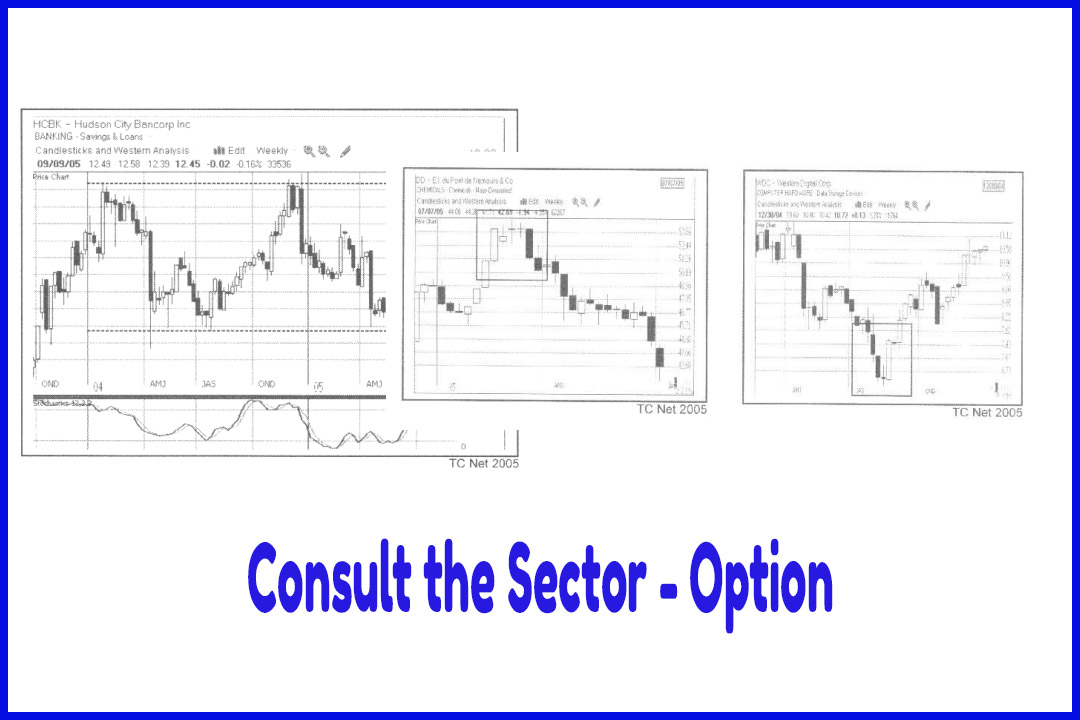
Another
technical event that may make a set-up stronger is when price tests a long-term
Moving Average, such as the 50- or 200-period. These Moving Averages are
watched closely by experienced traders. They often provide support when price
declines to those levels. Conversely, when a downtrend reverses, longer-term
Moving Averages above may act as resistance.
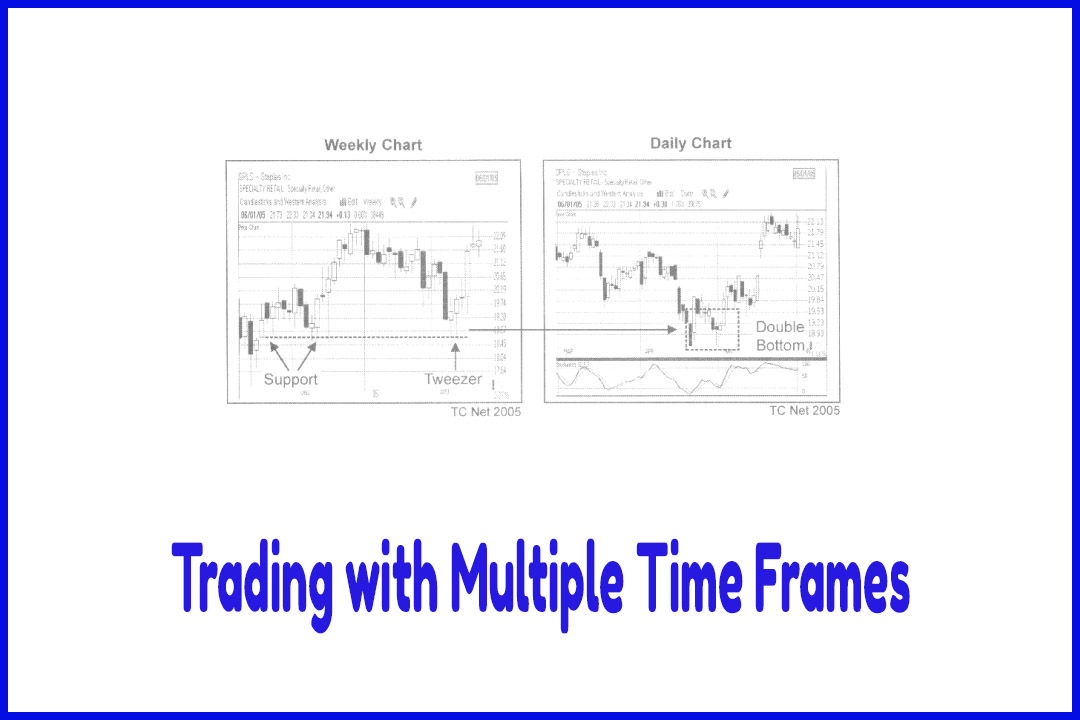
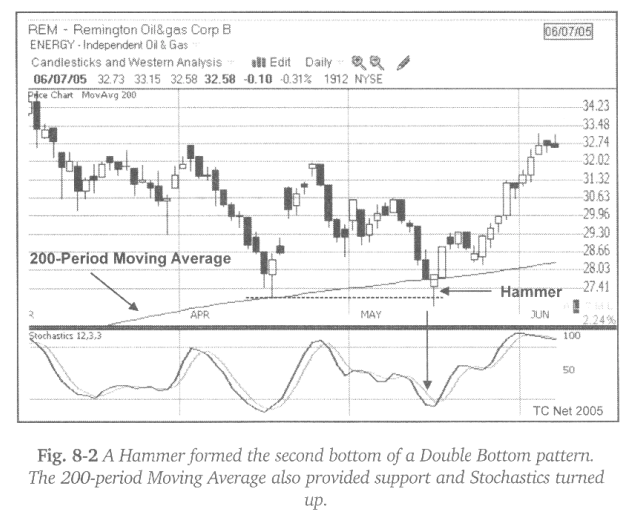
Figure
8-2 shows a chart of Remington Oil & Gas. This is a good example of several
signals coming together. A Double Bottom formed at the 200-period Moving
Average. The additional support provided by the strong indicator should
increase the likelihood of a reversal. In addition to the Western signals, a
bullish candlestick reversal pattern formed the second bottom of the larger
pattern. Usually the Stochastics will also curl up from the oversold level.
However, if the second bottom is slightly higher than the first bottom, because
of the loss of momentum on the second bottom, the Stochastics may not drop back
below the 20 line. It should still curl up though.
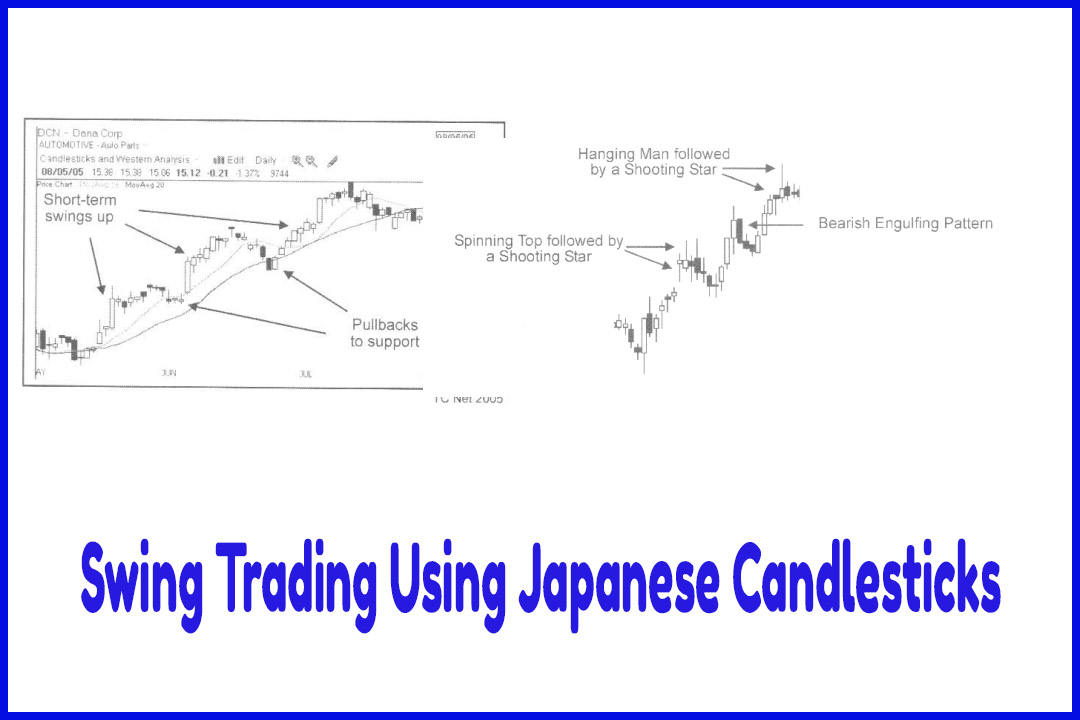
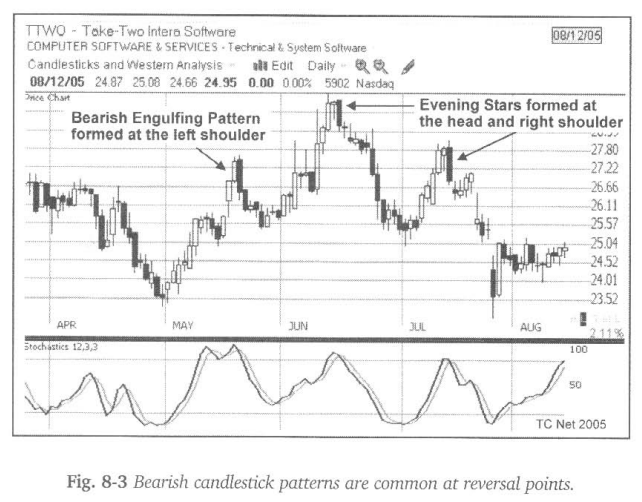
Candlestick
patterns are very common at reversal points. Figure 8-3 shows a bearish Head
and Shoulders Top that formed on Take-Two Intera Software. A bearish
candlestick pattern formed at each shoulder, and at the head, of the larger
pattern. The larger chart pattern alone is bearish. The formation of a bearish
candlestick at the right shoulder should increase the likelihood of follow
through to the downside. Stochastics also confirmed the turns. By the time the
right shoulder of the Head and Shoulders Top forms, price is already in a
downtrend. Because of that downward momentum, Stochastics may not rise back up
to the oversold level on the right shoulder.
To
confirm a short position, price should close below the neckline of the Head and
Shoulders pattern. The neckline touches the swing lows between the two
shoulders. Traders may choose to take an early entry rather than waiting for
confirmation, especially if there is bearish candlestick pattern that forms the
right shoulder. By that time the neckline is breached, the move is well under
way to the downside.
In the
Take-Two example, there is potential support at the May low. If a short
position is still open by the time price reaches a visible support level, it
should be covered. Price generally bounces, at least temporarily, at a strong
floor.
How To make High Profit In Candlestick Patterns : Chapter 7. Profitable Trading Insights : Tag: Candlestick Pattern Trading, Option Trading : option trading guidelines, option trading requirements, option trading good for beginners, best option stocks for beginners - Cluster of Signals