Price Gaps Trading Method
short-term trade, Technical Analysis with gaps, price gaps breakout, gap trading method
Course: [ How To make High Profit In Candlestick Patterns : Chapter 7. Profitable Trading Insights ]
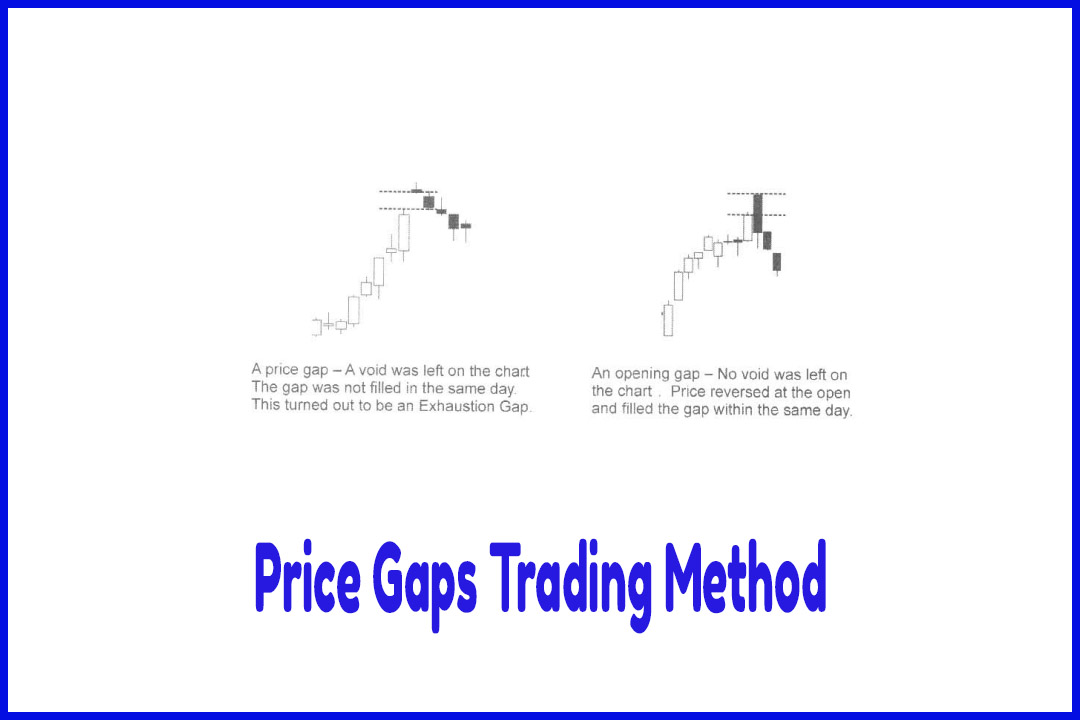
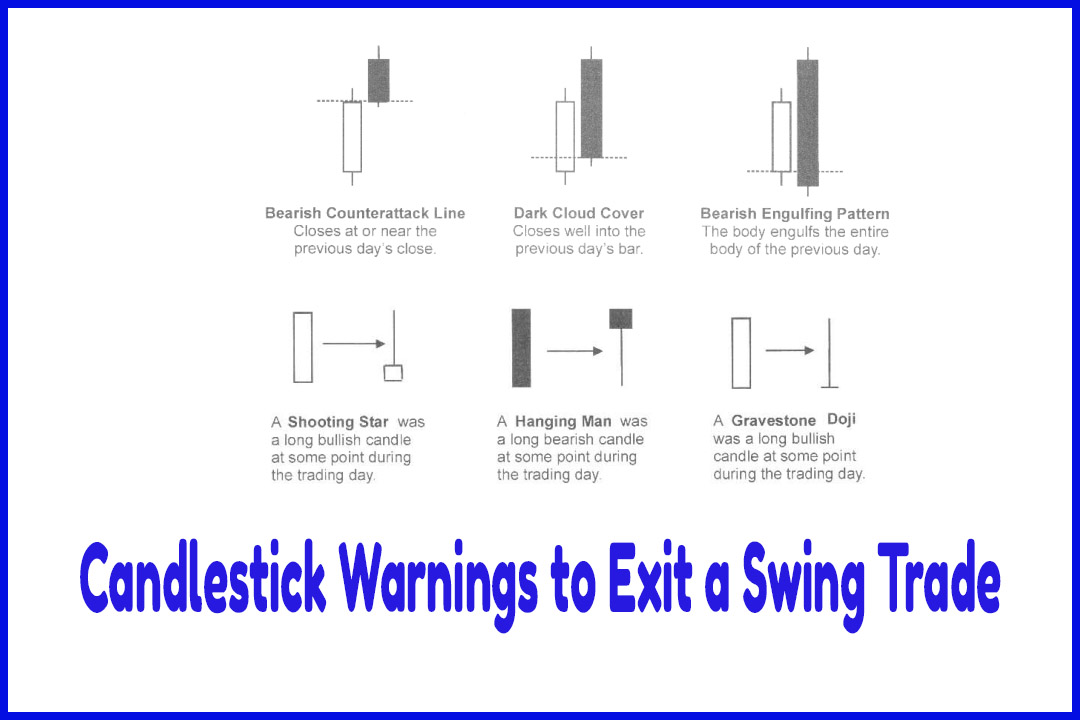
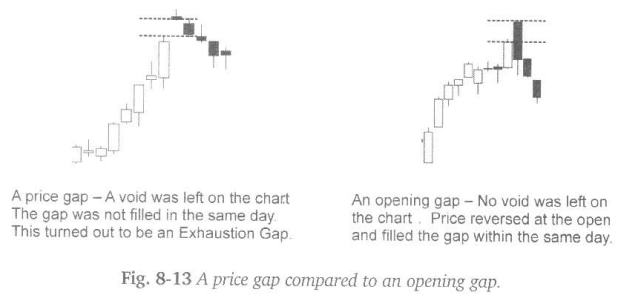
There are several types of price gaps. Their descriptions can be found in many books published on Technical Analysis. A price gap leaves a void on the chart where no trading took place. For a gap up to be present, the low of the current bar must be higher than the high of the previous bar.
There are
several types of price gaps. Their descriptions can be found in many books
published on Technical Analysis. A price gap leaves a void on the chart where
no trading took place. For a gap up to be present, the low of the current bar
must be higher than the high of the previous bar. On a gap down, the high of
the current bar must be lower than the low of the previous bar. All of the
major price gaps—breakaway, continuation, exhaustion and island reversals— leave
a price gap on the chart.
There is
one type of gap that is not as often discussed in the mainstream publications,
but is well known to experienced traders—the opening gap. An opening gap does
not require an actual void on the chart. This type of gap is defined by the
closing and opening prices of two candles. An opening gap up only requires that
today’s open be higher than yesterday’s close. The shadows of the two bars can
overlap. This leaves a gap between the two bothes. Vice versa for an opening
gap down.
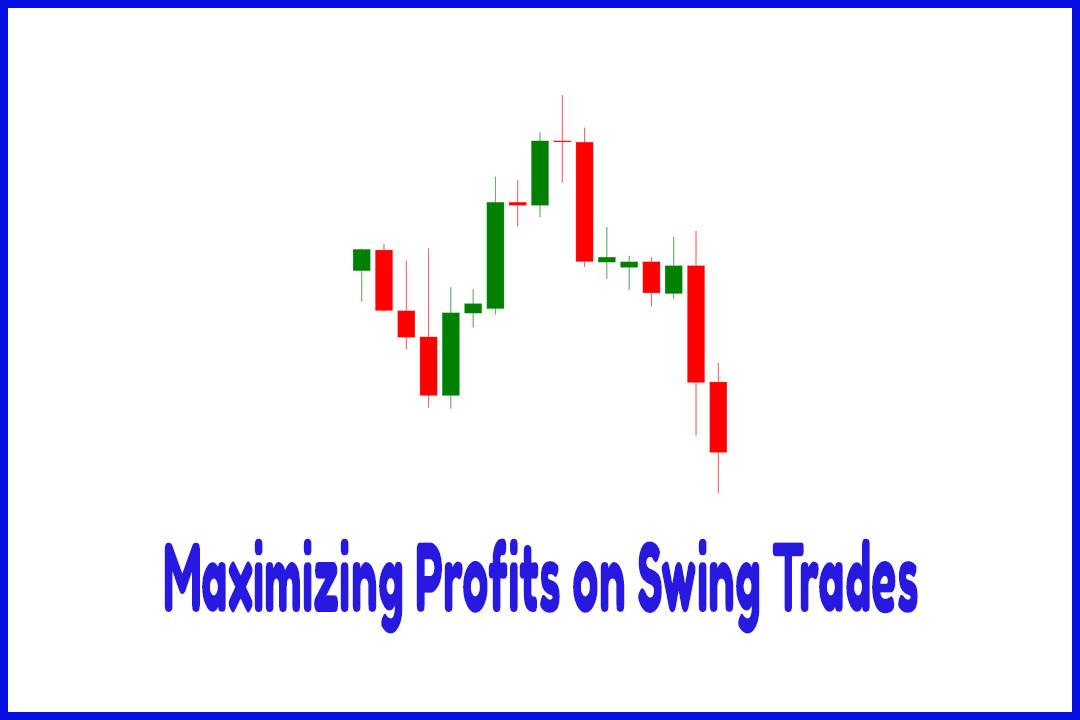
The
majority of opening gaps fill within the gap day. If price has already advanced
for several days and then gaps open, the chances of it filling should increase.
In most cases, exiting an opening gap will help maximize profits on a
short-term trade. It is important to understand the difference between price
gaps and opening gaps. Most gaps described in candlestick patterns refer to an
opening gap, but may not require the gap leave a void on the chart. Traders
should carefully read the description of the patterns.
How To make High Profit In Candlestick Patterns : Chapter 7. Profitable Trading Insights : Tag: Candlestick Pattern Trading, Option Trading : short-term trade, Technical Analysis with gaps, price gaps breakout, gap trading method - Price Gaps Trading Method