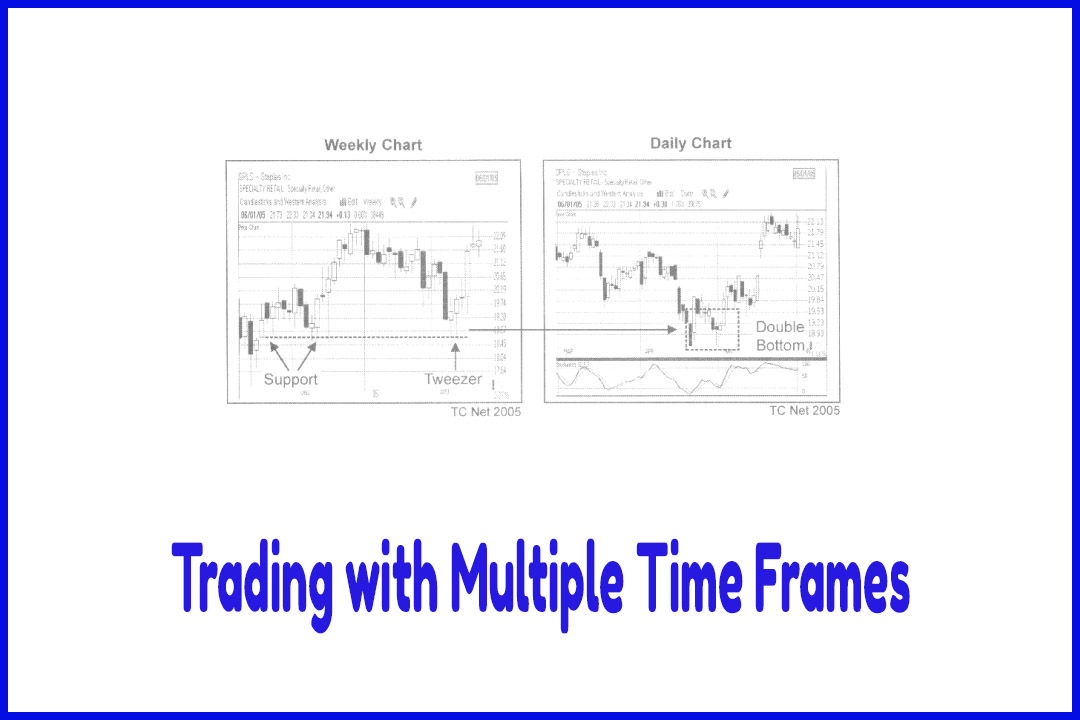
Trading with Multiple Time Frames
Time and Price, different time periods, Best Time to trade, Analysis Multiple Time frame
Course: [ How To make High Profit In Candlestick Patterns : Chapter 7. Profitable Trading Insights ]
While browsing weekly charts, you may come across some interesting set-ups that offer great trading opportunities. For example, a Tweezer Bottom is a pattern where the lows of two or more bars are at, or very near, the same price.
Trading with Multiple Time Frames
While
browsing weekly charts, you may come across some interesting set-ups that offer
great trading opportunities. For example, a Tweezer Bottom is a pattern where
the lows of two or more bars are at, or very near, the same price. Often a
Tweezer Bottom on a weekly chart will be a Double Bottom down on the daily
chart. Vice versa for a Tweezer Top.
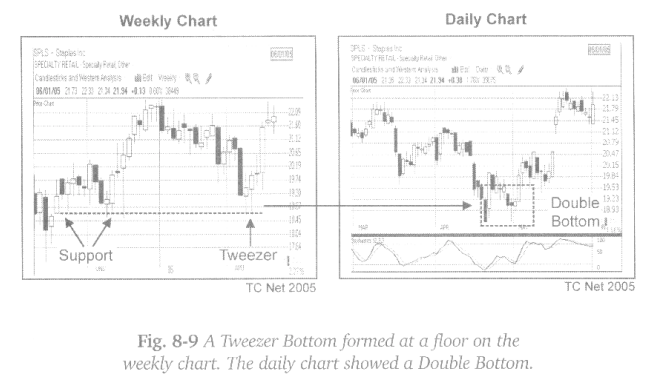
Figure
8-9 shows a weekly chart of SPLS with a Tweezer Bottom. The tweezer formed at a
floor that had been established several months prior. On the daily chart,
traders see a bullish Double Bottom. However, they may not notice that the
pattern is testing a strong floor unless they compress the daily chart or shift
to the weekly time frame. SPLS trended up for several weeks following the
successful retest of the strong support.
How To make High Profit In Candlestick Patterns : Chapter 7. Profitable Trading Insights : Tag: Candlestick Pattern Trading, Option Trading : Time and Price, different time periods, Best Time to trade, Analysis Multiple Time frame - Trading with Multiple Time Frames