Consult the Sector - Option
option trading guidelines, option trading requirements, option trading good for beginners, best option stocks for beginners
Course: [ How To make High Profit In Candlestick Patterns : Chapter 7. Profitable Trading Insights ]
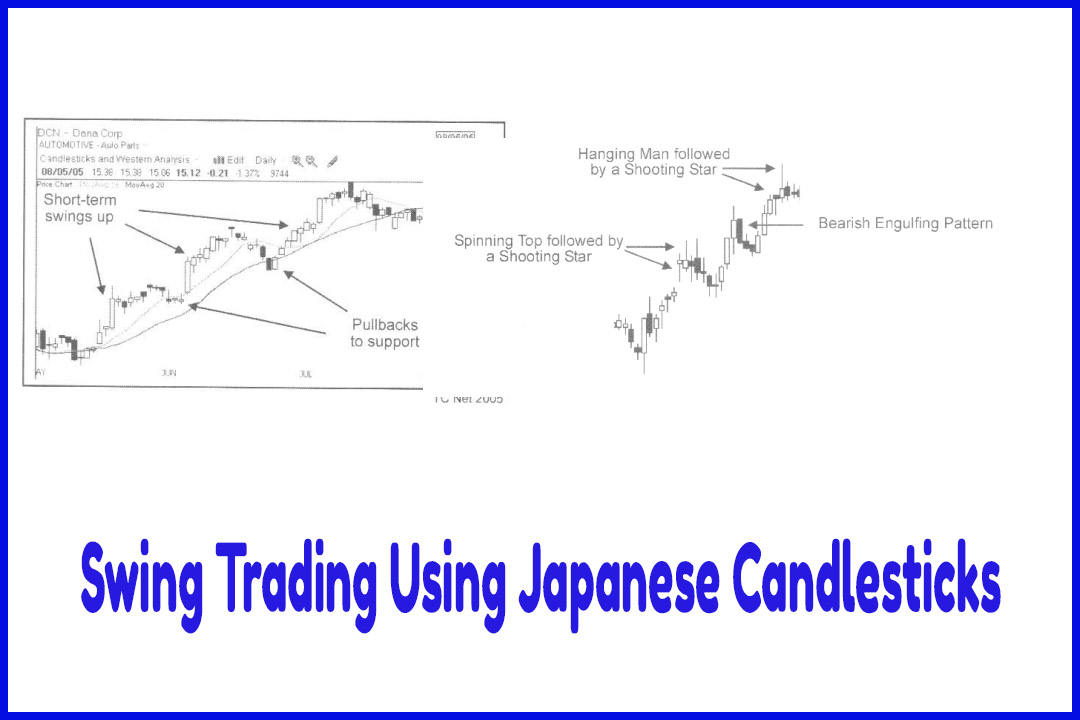
When a sector or industry group is in favor, the component stocks may run up for several weeks or even months. Eventually the overbought condition will cause a period of consolidation or a correction. A correction can be identified by a retracement of the previous trend.
When a
sector or industry group is in favor, the component stocks may run up for
several weeks or even months. Eventually the overbought condition will cause a
period of consolidation or a correction. A correction can be identified by a
retracement of the previous trend.
A stock
in a strong sector may resume the uptrend once price has corrected
sufficiently. Traders who wish to participate in the resumption of the prior
uptrend should watch closely for signals indicating that the correction may be
ending.
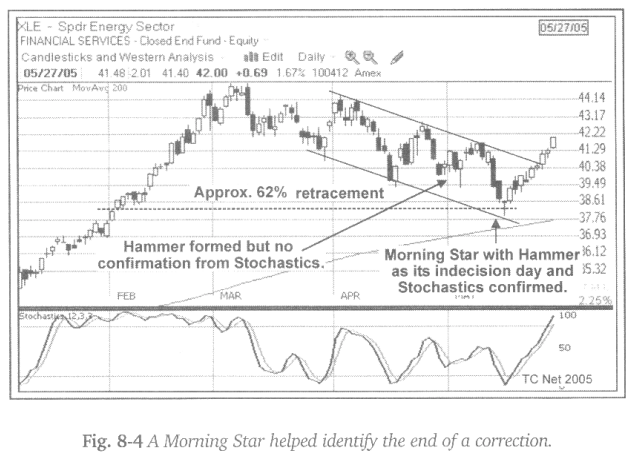
Many
stocks in the Energy sector made significant advances during 2005. Figure 8-4
shows XLE, the Spider Sector ETF for the Energy group. After the price advance
from the January low to the March high, price retraced a significant amount of
the previous uptrend. The retracement was approximately 62%, a well-known
Fibonacci level.
A bullish
Morning Star also formed near that level indicating a possible end of the
correction. Several days later price closed above the top trend-line of a
falling channel giving further evidence that price was rising again. The correction
provided an excellent opportunity for traders to purchase shares at lower
prices.
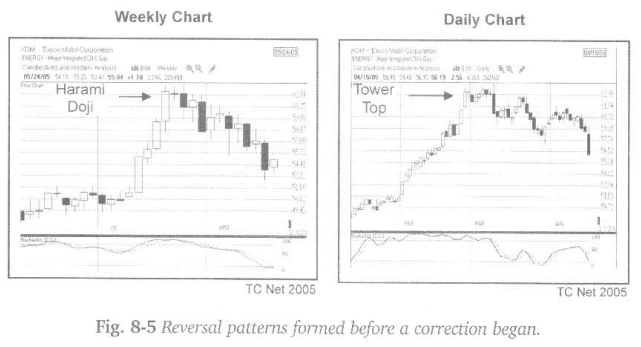
Oil
stocks were a hot commodity during 2005. They were a major contributor to the
run up in the XLE chart illustrated above. A challenge for traders was to know
at what point the stocks in this industry had run up too far. Figure 8-5 shows
a significant run up on Exxon Mobil. Traders who watched closely for reversal
signals received timely warnings that Exxon was about to reverse direction.
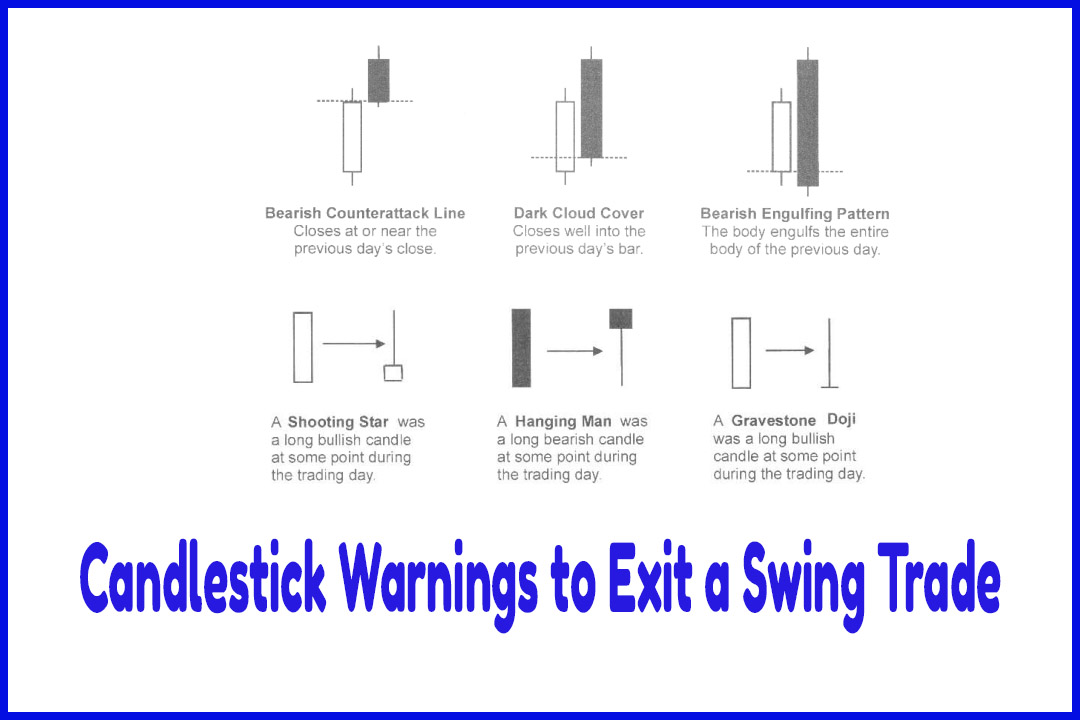
Reversal
candlestick patterns formed on both the daily and weekly time frames. Figure
8-5 shows a bearish Harami-Doji (also referred to as a Harami Cross) on the
weekly chart. Figure 8-5a shows a Tower Top on the daily chart.
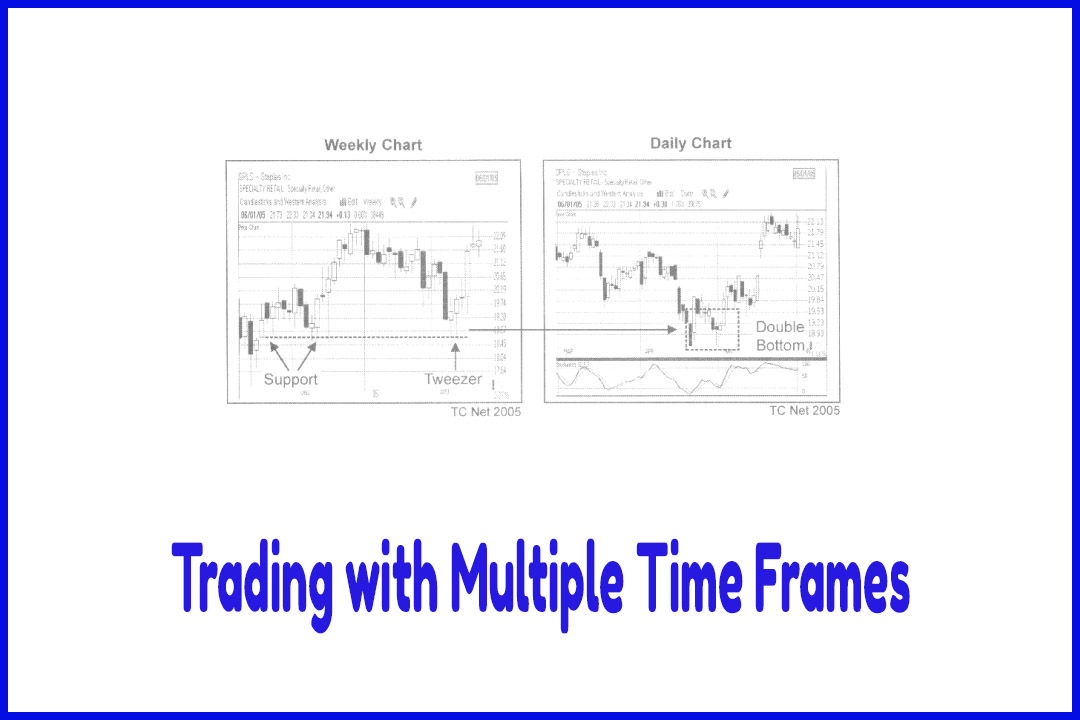
Traders
who primarily view charts on the daily time-frame can gain an edge by also
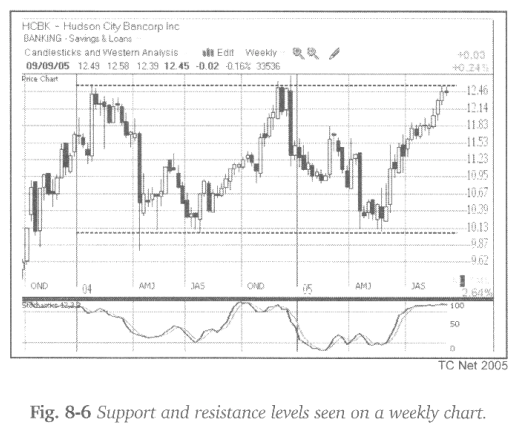
incorporating the weekly chart in their analysis. Support and resistance
levels, that may not be seen within the time-period displayed on the daily
chart, can easily be seen on the weekly chart.
Sometimes
support and resistance levels formed months, or even years, in the past.
However, they will be seen by chartists consulting the higher timeframes, such
as weekly or monthly. Just because a support or resistance level is “old,” does
not mean it is not still strong.
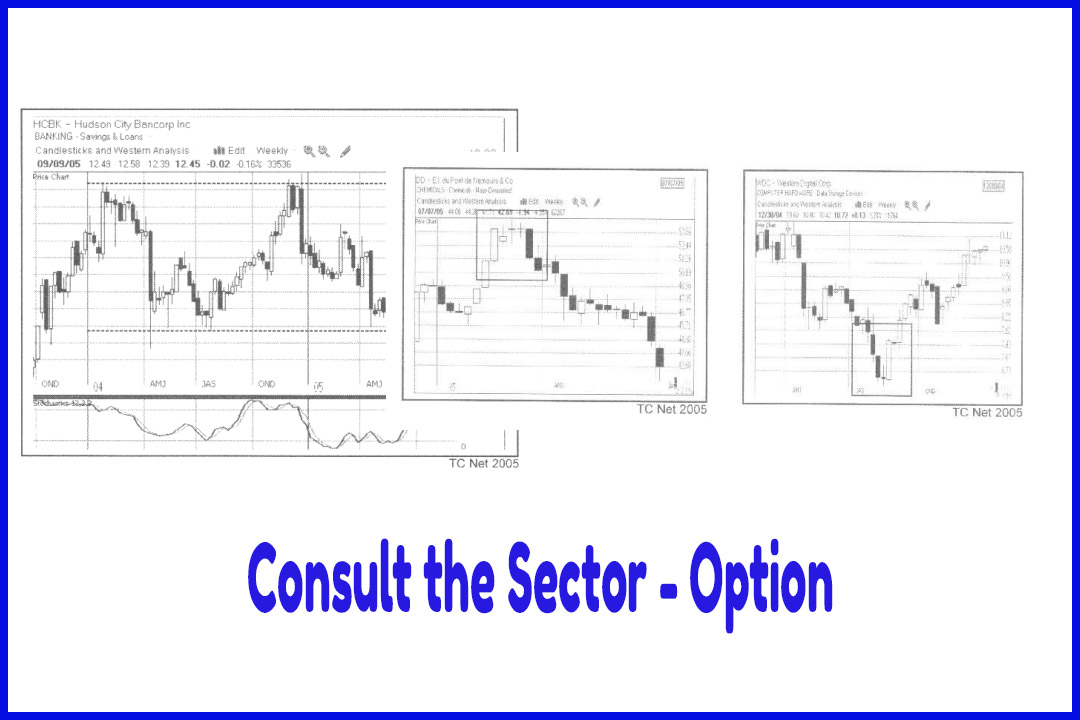
Figure
8-6 shows a weekly chart of Hudson City Bancorp. On this view, it is easy to
see that the stock has traded in a range for a couple of years. Looking at just
a few months of data on a daily chart does not give as thorough a picture as
can be seen on the weekly chart.
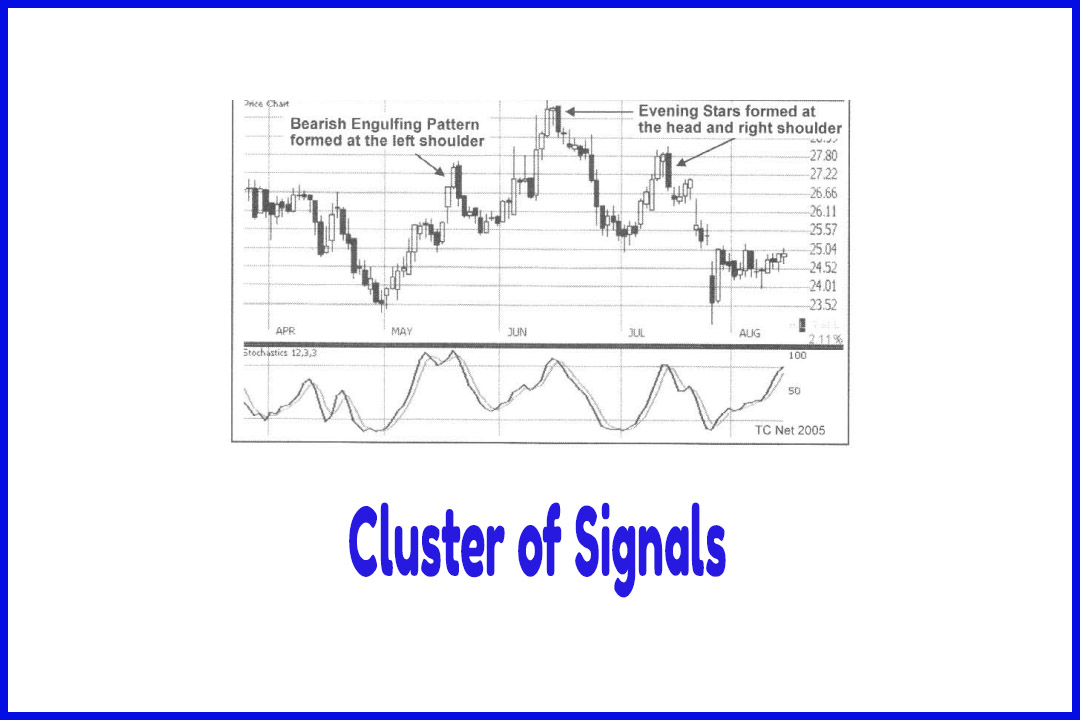
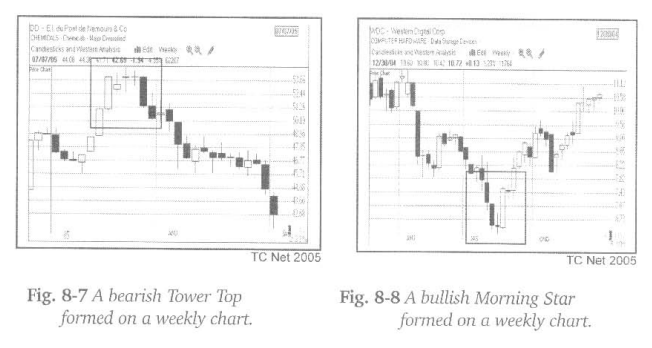
Candlestick
patterns are visible on all timeframes. The higher the time frame the more
meaningful the implication of the pattern. If a bearish reversal pattern forms
at the end of an advance on the weekly or monthly chart, ignore it at your own
peril!
How To make High Profit In Candlestick Patterns : Chapter 7. Profitable Trading Insights : Tag: Candlestick Pattern Trading, Option Trading : option trading guidelines, option trading requirements, option trading good for beginners, best option stocks for beginners - Consult the Sector - Option