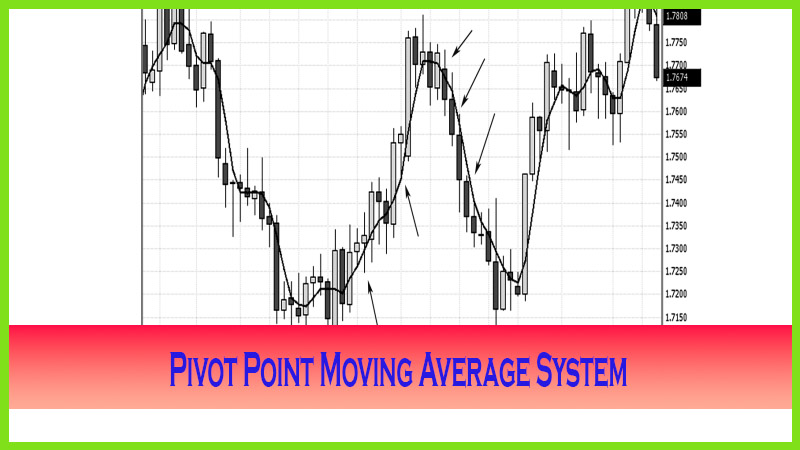
Conditional Optimized Moving Average System
pivot point moving average system, forex 3 moving average system, Moving average trading, ma trading strategy
Course: [ The Candlestick and Pivot Point Trading Triggers : Chapter 6. Pivot Point Moving Average System ]
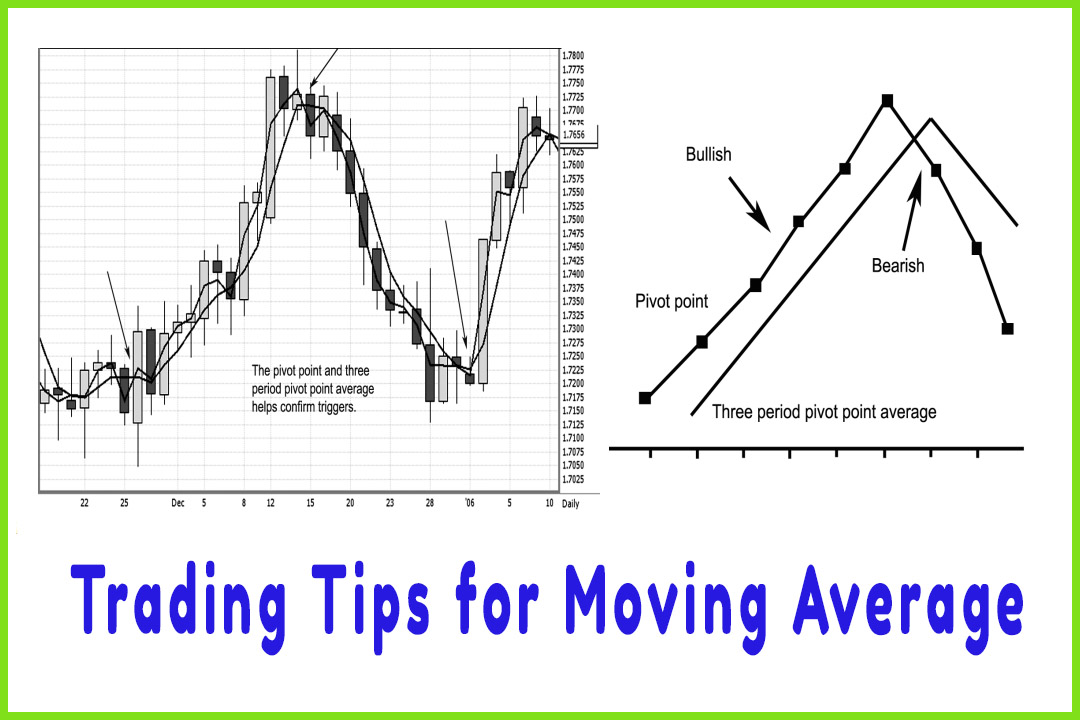
The Conditional Optimized Moving Average System™ (COMAS) incorporates the pivot point moving average approach with another variable. This method combines two moving averages. The resulting system provides a powerful crossover trigger to enter the market as well as an indicator of the move’s strength with the slope and the difference, or separation, of the moving average lines.
CONDITIONAL OPTIMIZED MOVING AVERAGE SYSTEM
The
Conditional Optimized Moving Average System™ (COMAS) incorporates the pivot
point moving average approach with another variable. This method combines two
moving averages. The resulting system provides a powerful crossover trigger to
enter the market as well as an indicator of the move’s strength with the slope
and the difference, or separation, of the moving average lines.
A
crossover provides both the entry and the exit signals, in addition to a set of
rules or conditions. This system works on any time frame, five minutes and
greater, and in any high-volume market. It is an excellent short-term trading
method for highly liquid markets such as forex, for certain futures markets,
and for stocks that have ample trading volume. One variation of what I use in
my trading library with the Genesis Software and teach in our Trading Triggers
University is the one-period pivot point with the three-period moving average
of the pivot point. There are other combinations you can use, such as a
five-period pivot point moving average of the pivot point with a two-period
simple moving average of a close. I test various time periods and variables for
my parameter settings because of the various conditions each market has. After
all, bonds move differently than the e-mini-Standard & Poor’s (S&P)
500, the mini-Dow, the Russell, or the Nadsdaq does. You may agree that forex
currencies move differently than individual stocks. The bottom line is this: I
use the two moving average values to help me identify a shift in momentum of
the market; and then as the conditions change, such as a close above or below
the values of both moving averages, I use the pivot point filtering method to
help me identify a potential profit target.
For the
purposes of this book, let me show you how to integrate the pivot point with
the three-period moving average of the pivot point. In Chapter 5, I disclosed
how to filter the pivot support and resistance levels by labeling the market
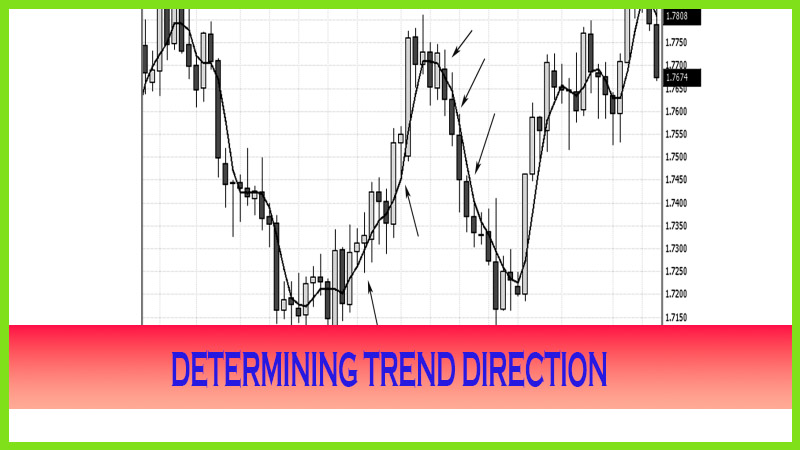
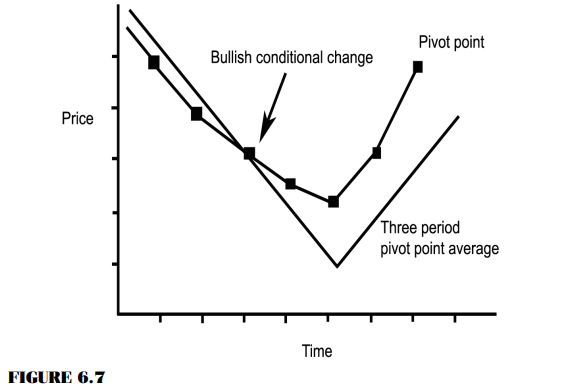
condition as neutral, bullish, or bearish. You can also chart and track the
conditional change of the market by plotting the directional change in the two
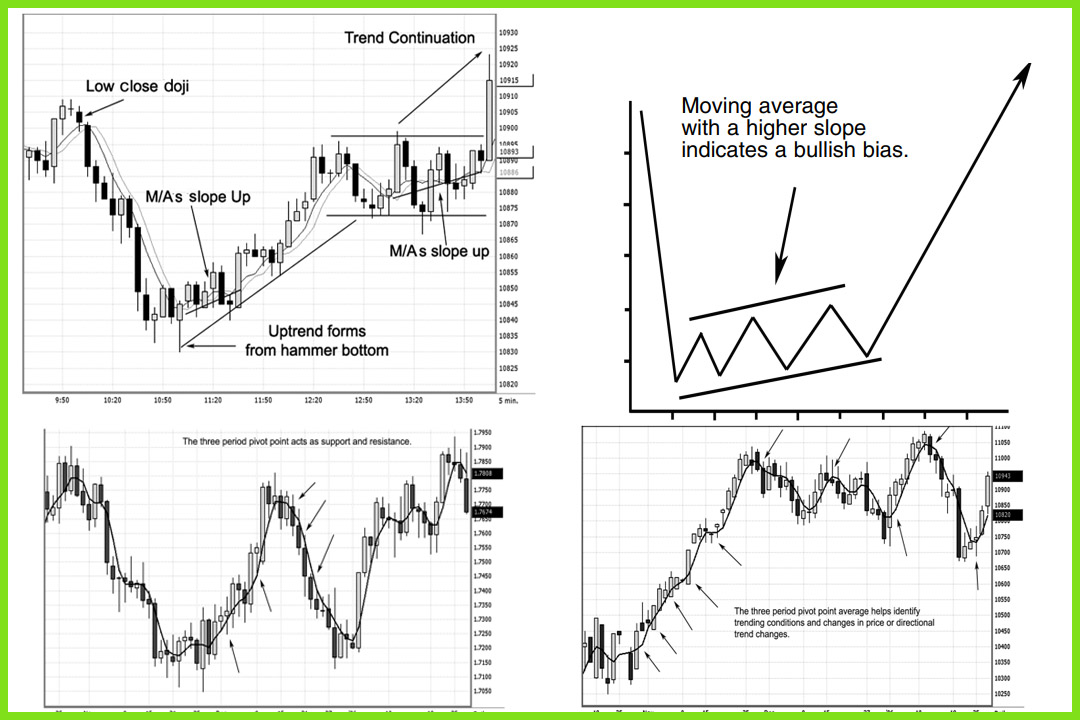
moving average settings. Figure 6.7 shows both moving average values declining;
but as the pivot point crosses above the three-period moving averages, it
alerts us that the internal market condition is changing to bullish. Once both
moving averages start to point up and the pivot point is above the three-period
pivot point average the market condition confirms we are in a bullish trend. As
a general rule, a trader would look to buy from an area of support in a market
that is trending upward (buy pullbacks).
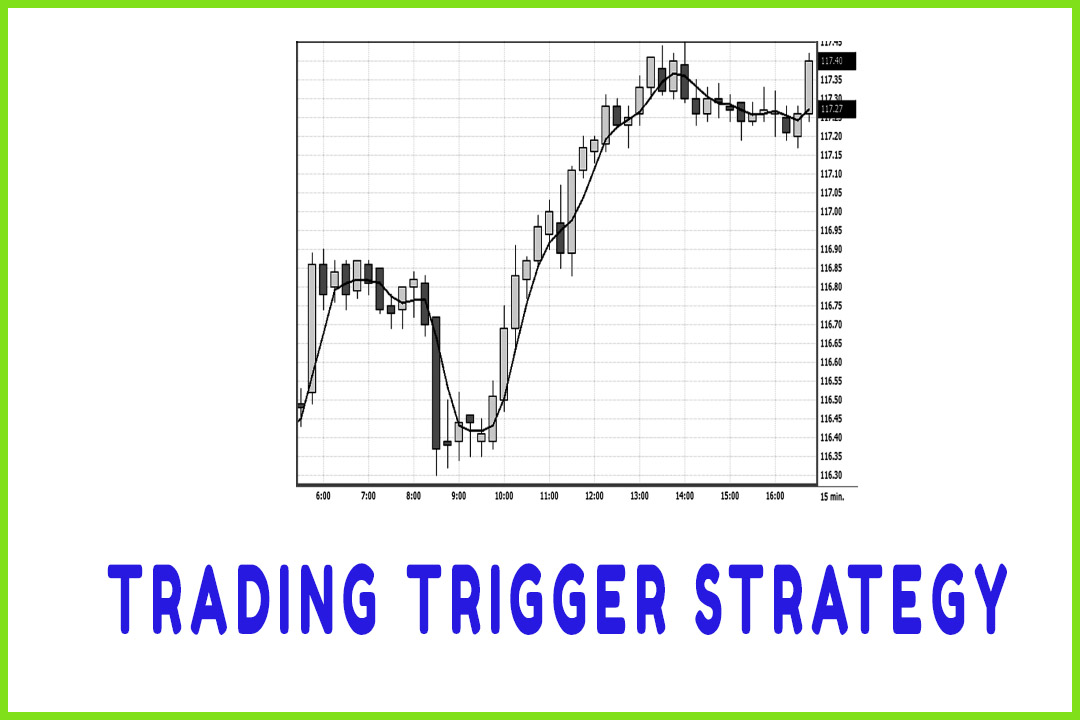
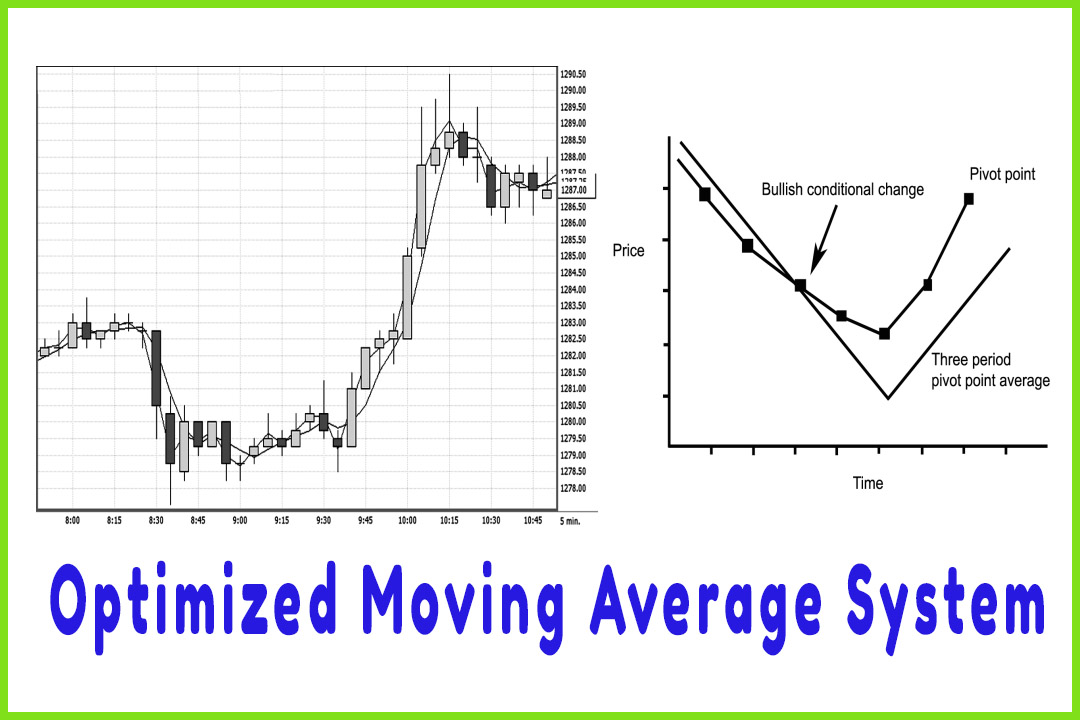
Figure
6.8 shows a five-minute chart on the e-mini-S&P 500 futures. In the preopen
outcry session around 8:00 a.m. (yes, you can trade preopen outcry session),
notice that the market is trading sideways and that the moving average values
are as well. Then by 8:30 a.m., the market turns lower and goes into a
congestion phase trading sideways until 9:45 a.m. The tall white candle closes
above both moving average values and above the prior time period’s high (which
was a hammer pattern). As the market starts to move in a bullish trend mode,
focus on the action of the moving averages in relation to prices. The pivot
point is above the three-period moving average pivot point; and there are
higher highs, higher lows, and higher closing values above both moving averages
and past highs. This series of conditions continued until after the top was
formed by a shooting star at 10:15 a.m. The trigger to go long occurred after
the breakout of the sideways range at 1282.25 and after the trigger to exit the
trade was initiated at 1288. This was a 5.75-point gain per contract.
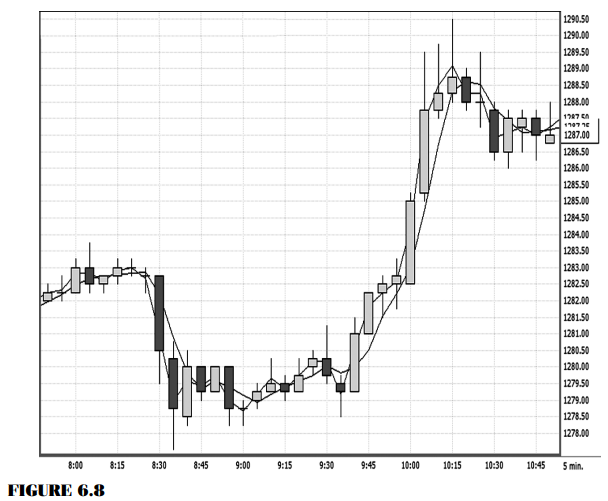
The focus is that prices traded above both moving average values and that the three-period pivot point moving average acted as support all the way up. Both moving averages were moving in tandem with each other, and the slope of both averages was pointing in the direction of the trend.
The Candlestick and Pivot Point Trading Triggers : Chapter 6. Pivot Point Moving Average System : Tag: Candlestick Pattern Trading, Forex, Pivot Point : pivot point moving average system, forex 3 moving average system, Moving average trading, ma trading strategy - Conditional Optimized Moving Average System